Analysis 1: Undergraduates made up the majority of the survey respondents
Upon hovering on the selected bar chart:
| Key Findings
|
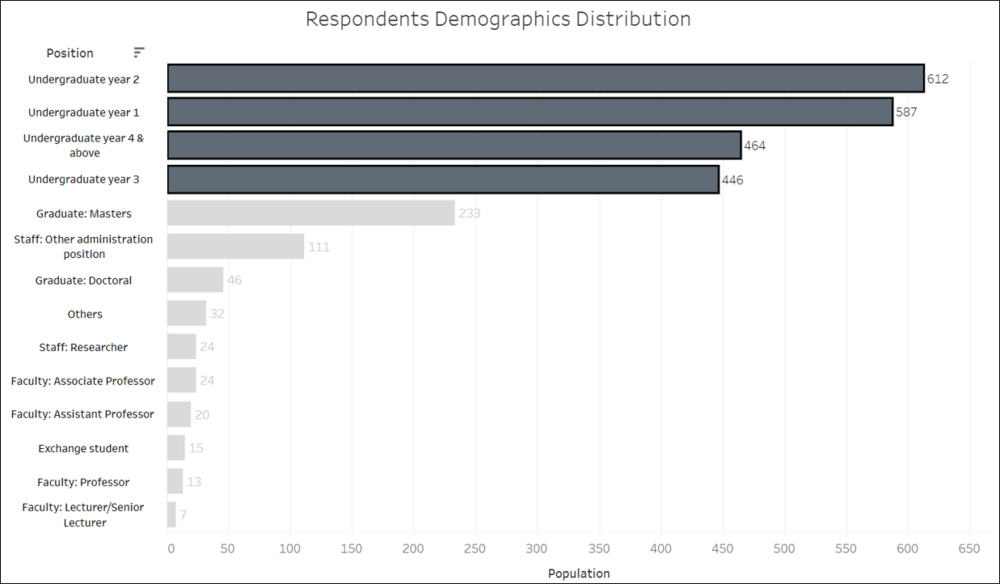
- The undergraduates made up the majority of the survey respondents with year 2 being the highest, followed by year 1, year 4 & above and year 3.
- Upon hovering on the highlight bar charts, we can see that for the undergraduate’s study area, most of them are from Business, followed by wither Information Systems or Accountancy.
- We have about an equal proportion of respondents from the Social Sciences, Economics and Law.
|
Analysis 2: Li Ka Shing is the more preferred library overall
Upon hovering on the selected bar chart:
| Key Findings
|
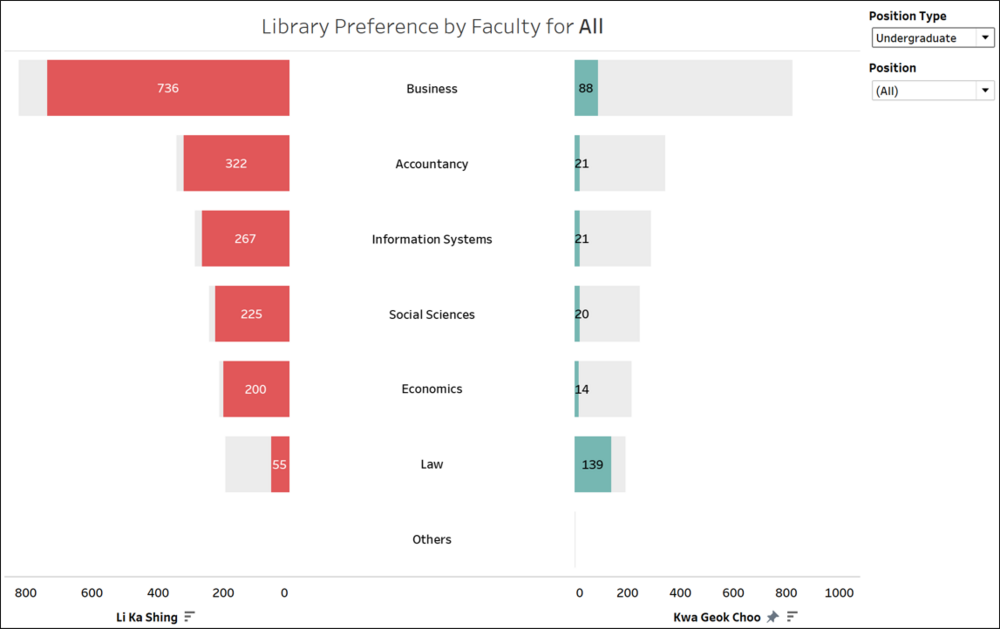
- Li Ka Shing Library is the more preferred library over Kwa Geok Choo Library.
- Undergraduates from Business has the highest number of records for preferring Li Ka Shing Library over Kwa Geok Choo Library. This could be due to convenience based on distance. Li Ka Shing Library is nearer to SMU School of Business.
- Undergraduates from Law has the highest number of records for preferring Kwa Geok Choo Library over Li Ka Shing Library. This could be due to convenience based on distance. Kwa Geok Choo Library is nearer to SMU School of Law.
- There is minimal difference in the overall satisfaction rate for Li Ka Shing Library and Kwa Geok Choo Library. This applies to undergraduates from all study areas.
|
Analysis 3: SMU Libraries resources and services are mostly utilised on a weekly basis
| Key Findings
|
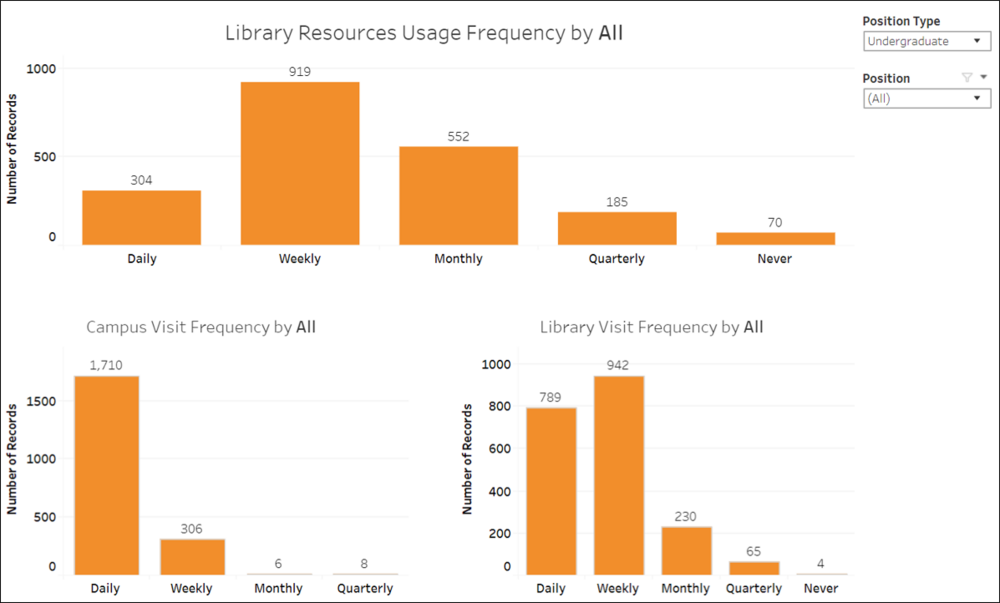
- Undergraduates use the SMU Libraries resources mostly on a weekly basis.
- Undergraduates visit the campus mostly on a daily basis.
- Undergraduates visit the SMU Libraries mostly on a daily to weekly basis.
|
Analysis 4: The top 3 important services are – Wifi, quiet place in the library and printing, scanning & photocopying services
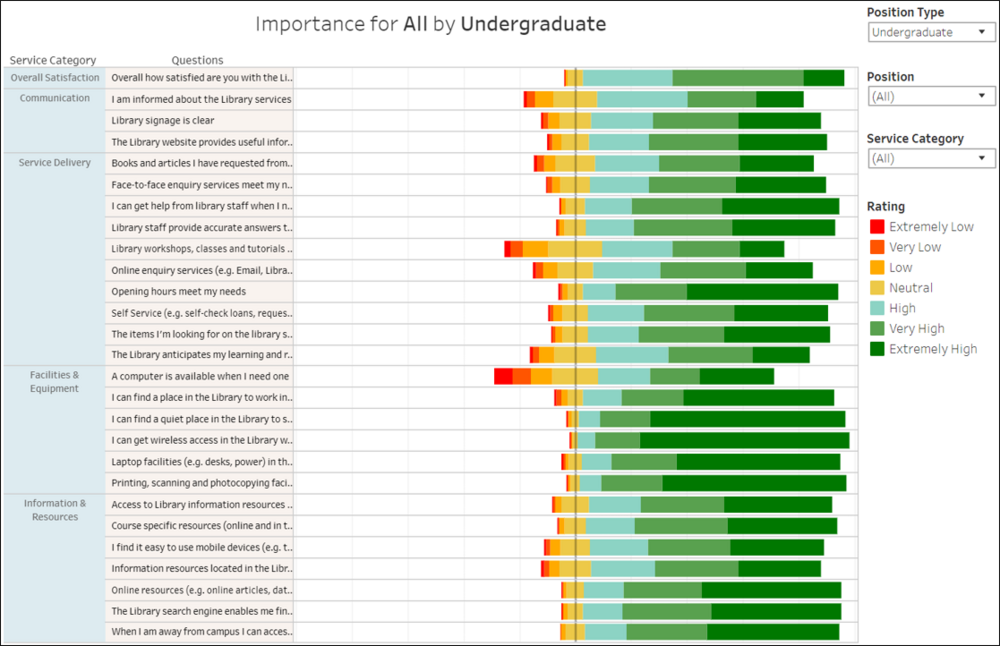
Importance Overall
| Key Findings
|
- By looking at which bar is more skewed towards the right, the perceived top 3 important services provided by SMU Libraries for the undergraduates are:
- Wifi access
- Quiet place in the library
- Printing, scanning & photocopying services
- In terms of services by category, we can see that facilities & equipment is of highest importance.
- By looking at which bar is more skewed towards the left, the perceived last 3 important services provided by SMU Libraries for the undergraduates are:
- Computer availability
- Library workshop, class & tutorials
- Informed about the library services
|
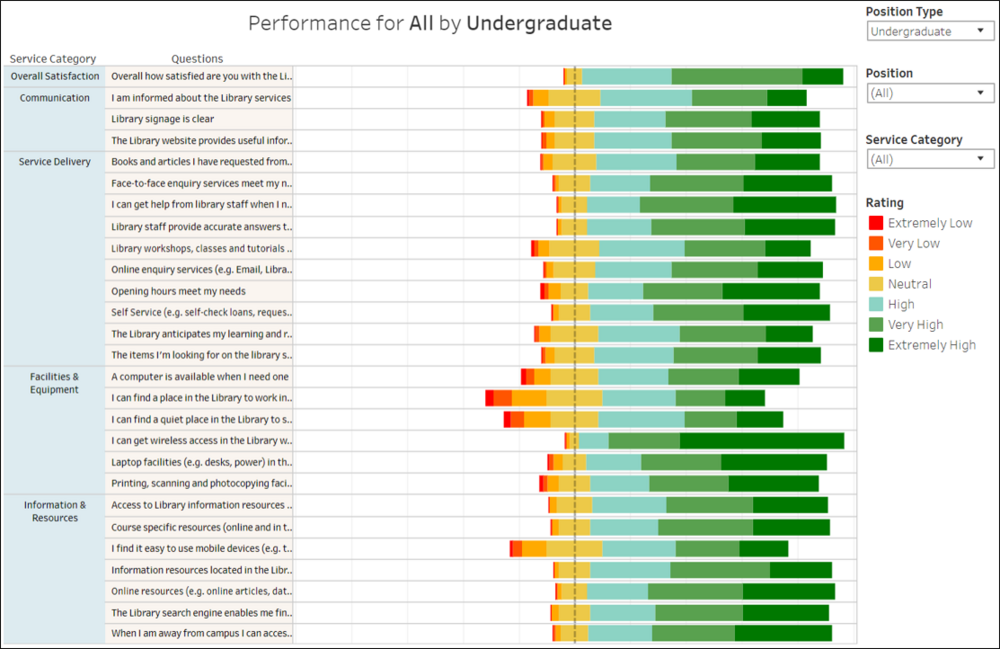
Performance Overall
| Key Findings
|
- By looking at which bar is more skewed towards the right, the perceived top 3 performance services provided by SMU Libraries for the undergraduates are:
- Wifi access
- Help from library staff
- Library staff provides accurate answer
- By looking at which bar is more skewed towards the left, the perceived last 3 performance services provided by SMU Libraries for the undergraduates are:
- Finding a place in the library
- Quiet place in the library
- Ease of mobile device usage
|
Comparing top perceived important category with perceived performance
Facilities & Equipment:
| Key Findings
|
- Important services with underperformed performances
- Finding a place in the library
- Quiet place in the library
- Laptop facilities
|
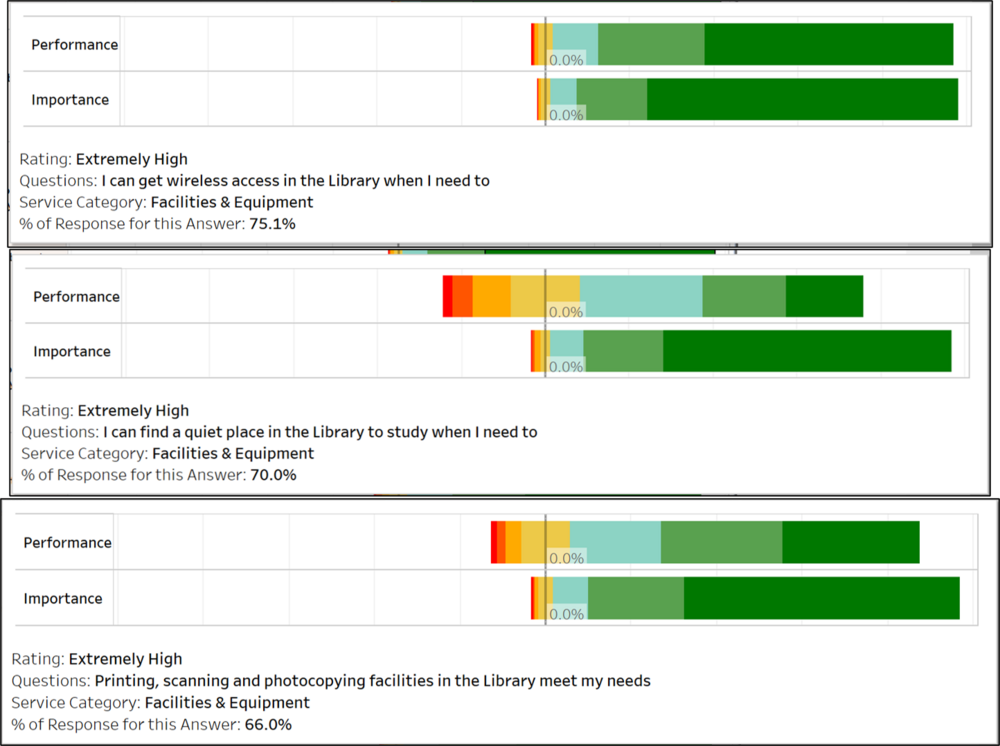
Comparing top perceived important services with perceived performance
| Key Findings
|
- All top 3 rated as importance services are perceived as underperformed.
- The highest discrepancy is attributed to finding a quiet space in the library 66.2% (performance) vs 95.5% (importance) rated more than neutral. The difference is 29.3%.
- The second service with the highest discrepancy is attributed to printing, scanning & photocopying services 82% (performance) vs 95.2% (importance) rated more than neutral. The difference is 13.2%.
- The service with the lowed discrepancy is attributed to wifi access 95% (performance) vs 97% (importance) rated more than neutral. The difference is 2%.
The figures are derived upon hovering over the selected bars. The calculation is done by summing up all the percentage for above neutral for importance and performance and then finding the difference between the 2 figures.
|
Analysis 5: There is a linear relation between the overall satisfaction and likelihood to recommend the SMU Libraries’ services to another student
Analysis 6: The top 3 mentioned words are: Seat (341 records), Study (303 records), Student (230 records)
Recommendations
