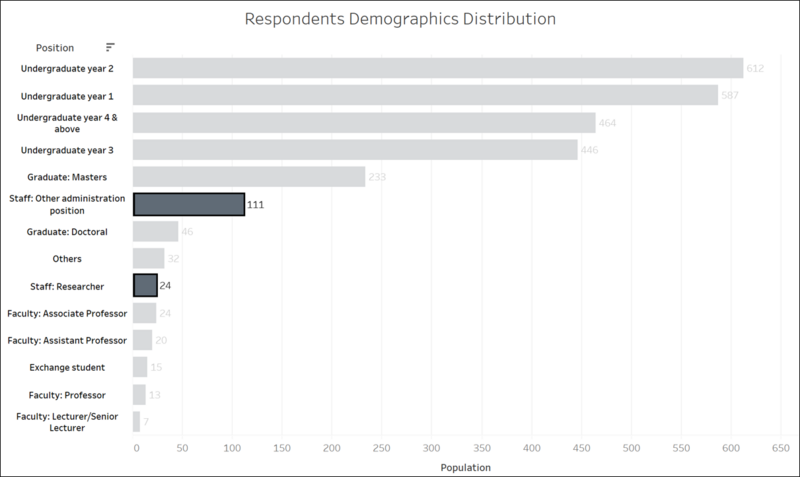
Analysis 1: Staff made up the 2nd last minority of the survey respondents
Upon hovering on the selected bar chart:
| Key Findings
|
- The staffs made up the 2nd last minority of the survey respondents with other administration position being the highest, followed by researcher.
- Upon hovering on the highlight bar charts, we can see that for the staffs’ study area, for other administration position, the study area is dominated at others followed by Business and then Information Systems at 60.36%, 16.22% and 11.71% respectively.
- For researcher, we have more people in Information Systems, Social Sciences and then Business at 50%, 16.67% and 12.5% respectively.
|
Analysis 2: Li Ka Shing is the more preferred library overall
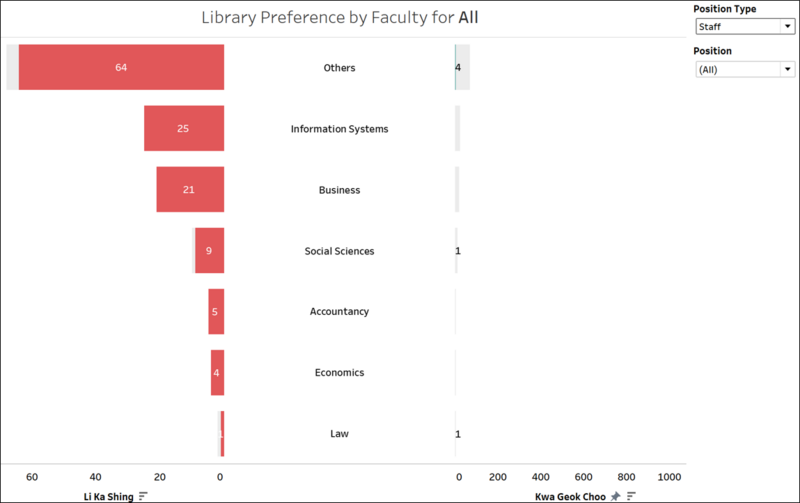
Upon hovering on the selected bar chart:
| Key Findings
|
- Li Ka Shing Library is the more preferred library over Kwa Geok Choo Library.
- The number of staffs prefer over Kwa Geok Choo Library can be counted manually due to its extremely low number at 6.
- Staffs from study area – Others, have the highest number of records for preferring Li Ka Shing Library over Kwa Geok Choo Library.
- There is minimal difference in the overall satisfaction rate for Li Ka Shing Library and Kwa Geok Choo Library. This applies to staffs from all study areas.
|
Analysis 3: Staff visits to the library and SMU Libraries resources are mostly utilised on a weekly to quarterly basis
| Key Findings
|
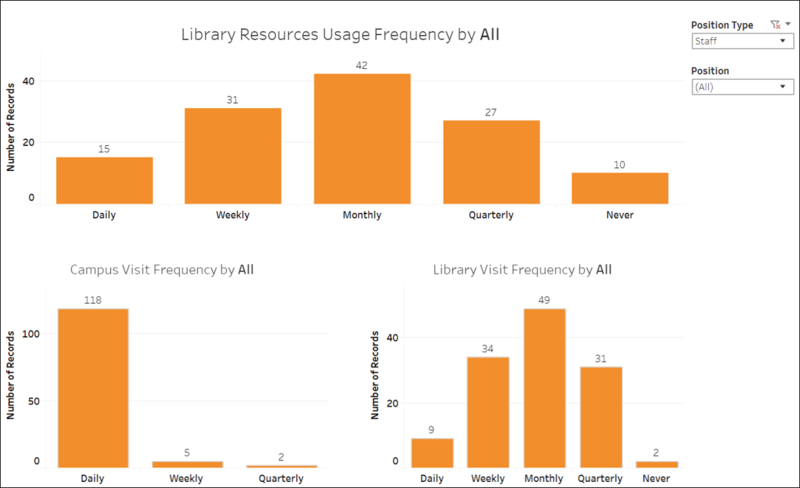
- Staffs use the SMU Libraries resources mostly on a weekly to quarterly basis.
- Staffs visit the campus mostly on a daily basis.
- Staffs visit the SMU Libraries mostly on a weekly to quarterly basis.
|
Analysis 4: The top 3 important services are – Help from library staff, library staff provides accurate answers and wifi access
Importance Overall
| Key Findings
|
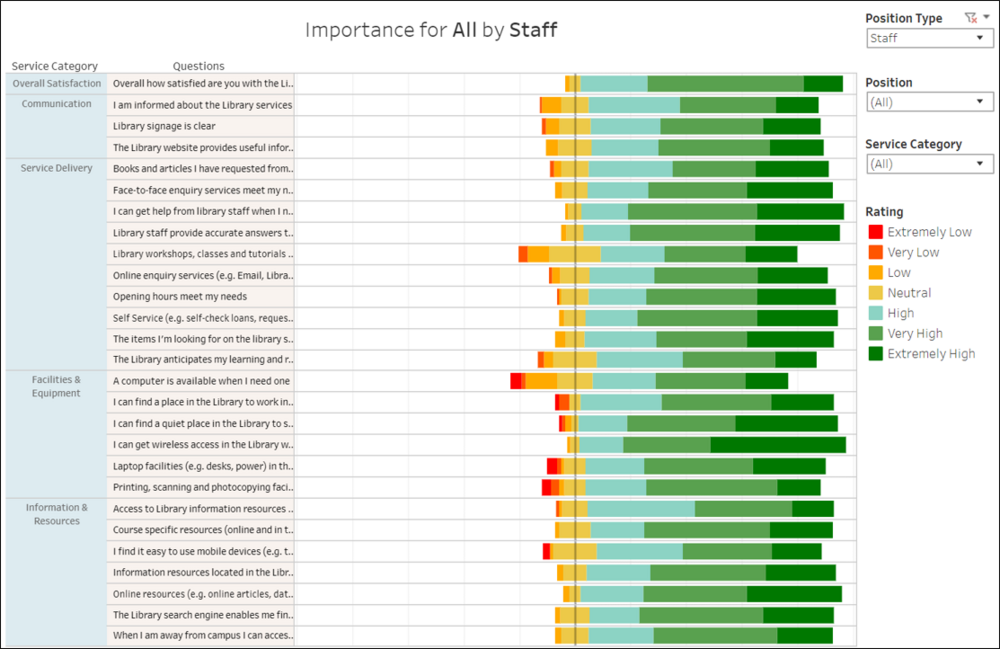
- By looking at which bar is more skewed towards the right, the perceived top 3 important services provided by SMU Libraries for the staffs are:
- Help from library staff
- Library staff provides accurate answers
- Wifi access
- By looking at which bar is more skewed towards the left, the perceived last 3 important services provided by SMU Libraries for the staffs are:
- Computer availability
- Library workshops, classes and tutorials
- Library anticipates my learning and resource needs
|
Performance Overall
| Key Findings
|
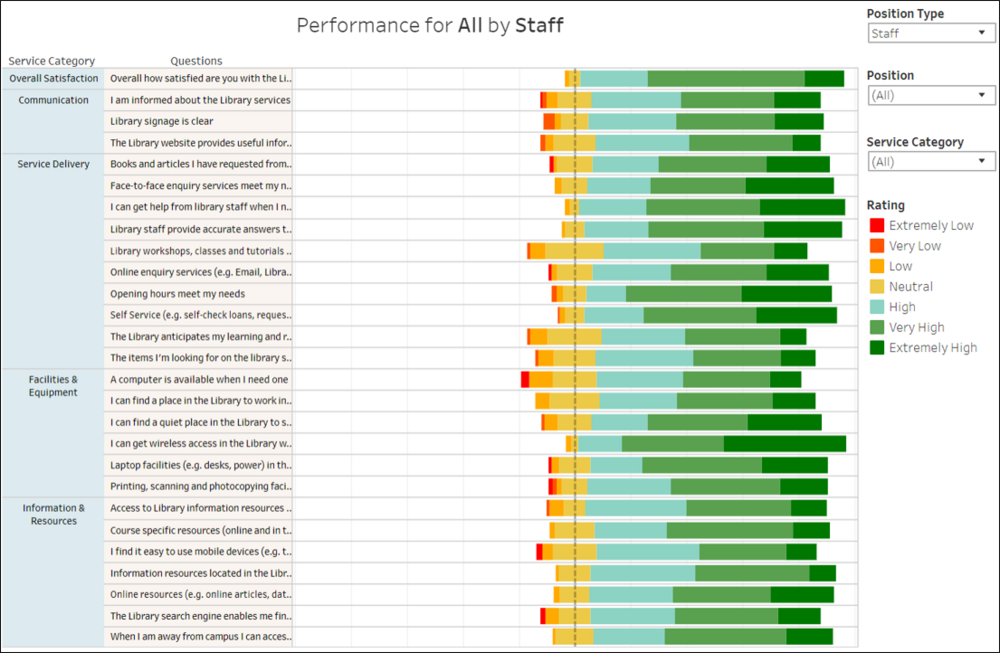
- By looking at which bar is more skewed towards the right, the perceived top 3 performance services provided by SMU Libraries for the staffs are:
- Wifi access
- Help from library staff
- Self service
- By looking at which bar is more skewed towards the left, the perceived last 3 performance services provided by SMU Libraries for the staffs are:
- Library anticipates learning and research needs
- Library workshop, classes and tutorials
- Items on the library shelves
|
Comparing top perceived important services with perceived performance
| Key Findings
|
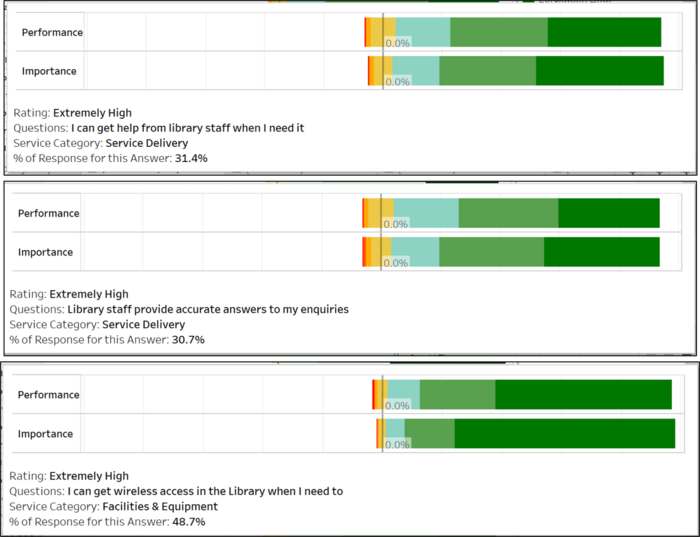
- All top 3 rated as importance services are perceived as “has met expectations” of the faculty due to the low discrepancy between importance and perceived performance.
- For help from library staff, there is only a slight discrepancy of 0.9% from 94.2% (importance) vs 95.1% (performance).
- For library staff providing accurate answers, there is only a discrepancy of 0% from 92.1% (importance) vs 92.1% (performance).
- For wifi access, there is only a discrepancy of 0% from 95.7% (importance) vs 95.7% (performance).
The figures are derived upon hovering over the selected bars. The calculation is done by summing up all the percentage for above neutral for importance and performance and then finding the difference between the 2 figures.
|
Analysis 5: There is a linear relation between the overall satisfaction and likelihood to recommend the SMU Libraries’ services to another student
| Key Findings
|
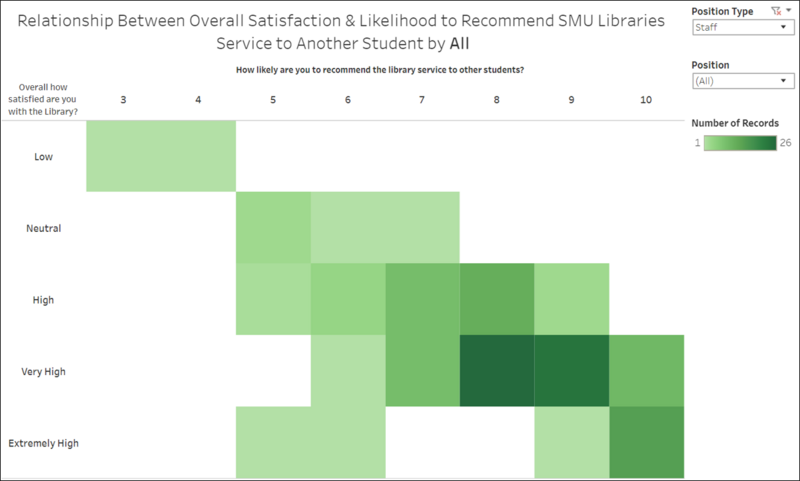
- There is a linear relation between the overall satisfaction and likelihood to recommend the SMU Libraries’ services to another student.
- The likelihood (high and above) for the staffs to recommend the SMU Libraries services to another student score an overall satisfaction score of about 8 (based on the darkness of colour).
|
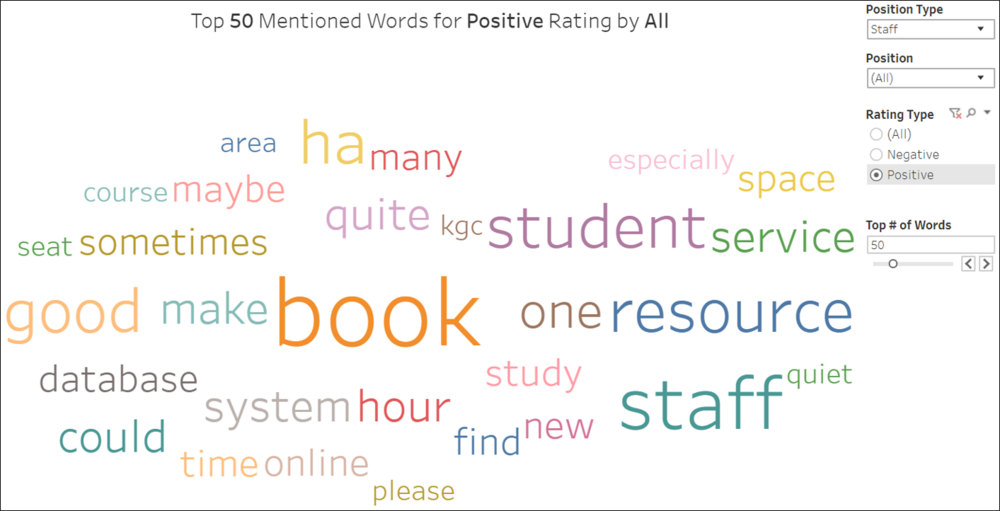
Analysis 6: The top 3 mentioned words are: Book (15 records), Staff (9 records), resource (6 records)
Positive
| Key Findings
|
- The top 3 mentioned words are:
- Book (15 records)
- Staff (9 records)
- Resource (6 records)
|
Negative
| Key Findings
|
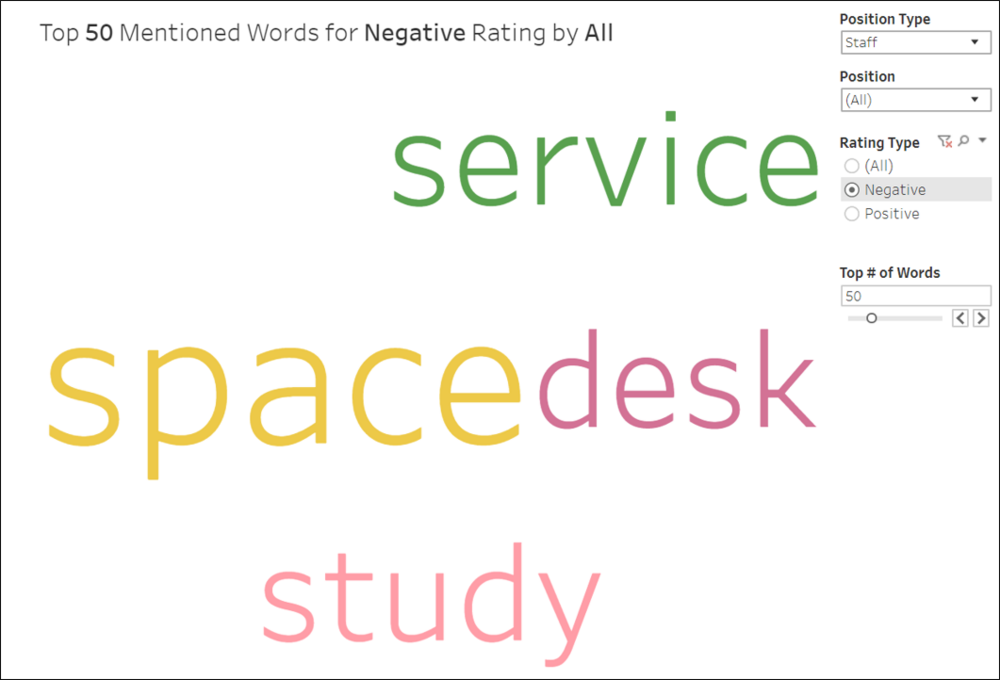
- The top 3 mentioned words are:
- Space (2 records)
- Service (1 records)
- Desk (1 records)
- Staffs barely give any comments which resulted in the small word cloud.
|
Overall
| Key Findings
|
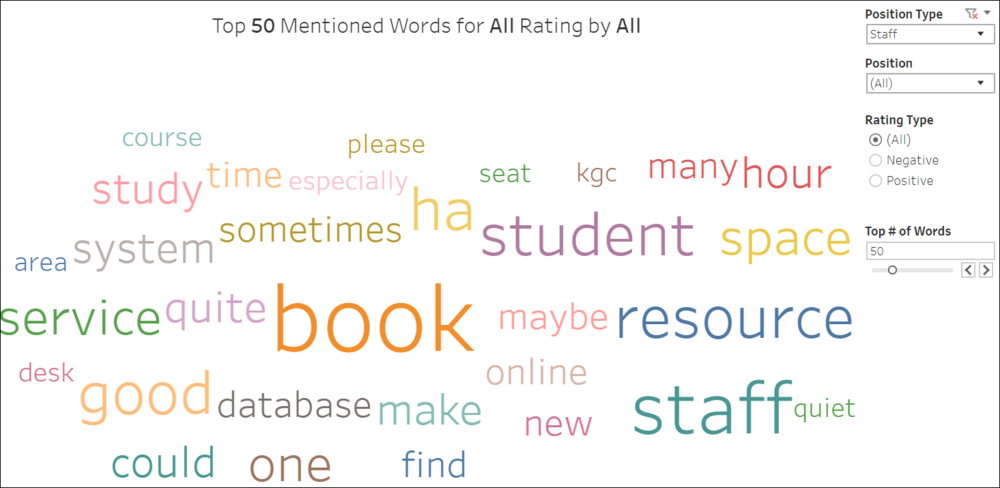
- The top 3 mentioned words are:
- Book (15 records)
- Staff (9 records)
- Resource (6 records)
Overall, the top words mentioned in the positive and overall cloud are the same. The negative cloud mentioned other words like space, service and desk. However, the number of records is too small to justify the negativity associated with it.
|
Recommendations
| Recommendations
|
- If needed to conduct another study with the staffs (2nd last minority), it can be in a small setting due to the small number of respondents.
- From the visit/usage frequency charts, we can see that the staffs seldom use SMU Libraries’ services (weekly to quarterly range). A recommendation to this is to conduct a user need survey with the staffs to understand how SMU Libraries better suit to their learning and research needs can.
- Distance may play a part to attract the staffs to a certain library. So, if there are any future SMU Libraries initiatives event, it should be held at the centre of the campus. Ideally it can be held at school of accountancy.
- With the word cloud, conduct another survey more specified to the words mentioned to improve the future SMU Libraries satisfaction rate.
- Even though the highlighted key words in the negative word cloud are low in number of records, the word Service coincide with the perceived lowest performance services presented in the Likert chart for Service Performance (Library anticipates learning and research needs, library workshop, classes and tutorials, items on the library shelves) Further study will have to conducted to determine the correlation.
|
