IS428 AY2019-20T2 Assign ONG LI TING: undergraduates
Revision as of 03:27, 16 March 2020 by Liting.ong.2016 (talk | contribs) (→Analysis 1: Undergraduates made up the majority of the survey respondents)
Contents
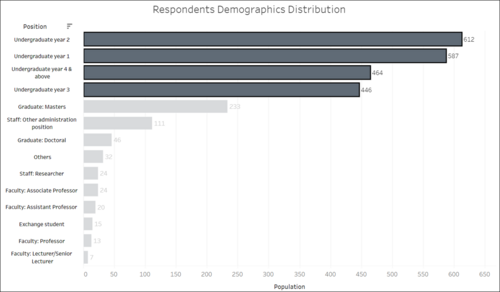
- 1 Analysis 1: Undergraduates made up the majority of the survey respondents
- 2 Analysis 2: Li Ka Shing is the more preferred library overall
- 3 Analysis 3: SMU Libraries resources and services are mostly utilised on a weekly basis
- 4 Analysis 4: The top 3 important services are – Wifi, quiet place in the library and printing, scanning & photocopying services
- 5 Analysis 5: There is a linear relation between the overall satisfaction and likelihood to recommend the SMU Libraries’ services to another student
- 6 Analysis 6: The top 3 mentioned words are: Seat (341 records), Study (303 records), Student (230 records)
- 7 Recommendations
Analysis 1: Undergraduates made up the majority of the survey respondents
Upon hovering on the selected bar chart:
| Key Findings |
|---|
|


