SMT201 AY2019-20T1 EX2 Erika Aldisa Gunawan
Jump to navigation
Jump to search
|
|
|
|
|
|
Take Home Exercise 2
Task: identify a location suitable for building a national Communicable Disease Quarantine Centre in Gombak planning subzone with a contiguous area of at least 10,000m2. The location must meet the following decision factors:
- Economic factor: The selected site should avoid steep slope. This is because construction at steep slope tends to involve a lot of cut-and-fill and will lend to relatively higher development cost.
- Accessibility factor: The selected site should be close to existing local roads, namely: service roads and tracks. This is to ensure easy transportation of building materials during the construction stage.
- Health risk factor: The selected site should be away from population i.e. housing areas and offices in order to avoid disease spreading to the nearby population.
- Natural conservation factor: The selected site should be away from forested land, park and water.
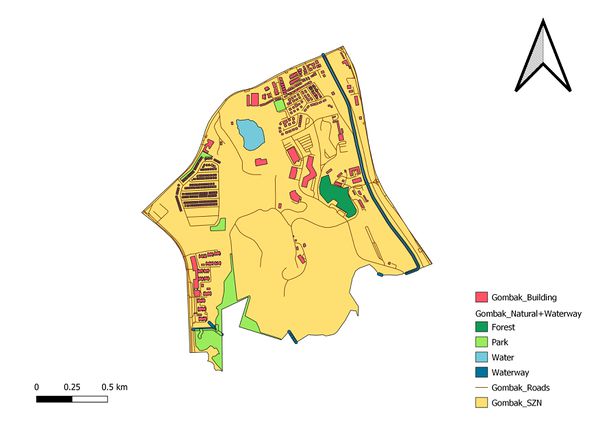
Composite map

This is the composite map of Gombak planning subzone which contains the building layer, natural features layer which consists of both Waterway and Natural layers combined through Union and the road layer. This map will be the base map of our further analysis.
Steps needed to do land suitability analysis:
- We will get the proximity map of each decision factor layer (roads, buildings, natural features and slope)
- We will give each proximity map a criteria to get ranked raster model by reclassifying the table
- We will rank the importance of the decision factors against each other to get the AHP matrix values
- Use the AHP Template to fill in the pairwise comparison matrix and get the weights for each decision factor
- We will use the Raster calculator to get the final raster map with the weights included
- We will reclassify the table again or use the raster calculator to filter the desirable or suitable value from the raster map to get our plot of land
- Vectorize the rasterized plot of land