Proximity Map Layout
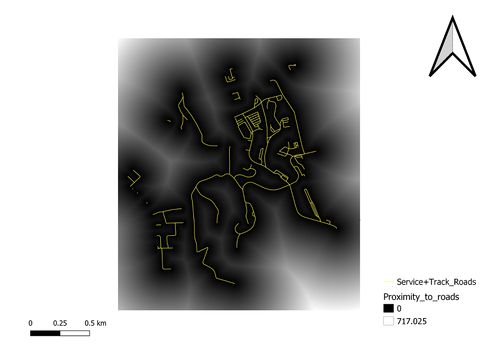
| Proximity to target roads This map layout shows the proximity map to Gombak’s target roads which are specified to be only service and track roads which would be used for the transportation of the construction materials. The legend shows that the black colour is 0 metre meaning that the black colour is 0 metres away from the target roads while the maximum distance from the target roads is 717.025 metres. |
|
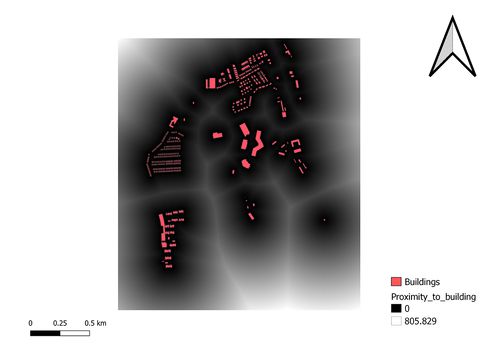
| Proximity to buildings This map layout shows the proximity to Gombak’s buildings which are mostly residential and commercial near the borders and the MINDEF office. The legend shows that the black colour represents 0 metre from the buildings whereas the white colour represents the maximum distance from the buildings which is 805.829 metres. |
|
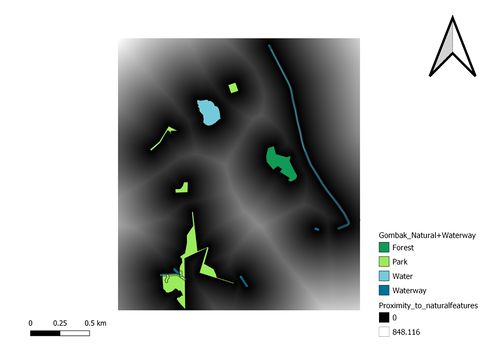
| Proximity to target natural features This map layout shows the proximity to Gombak’s natural features which are listed as forest, park, water and waterway. The legend shows that the black colour represents 0 metre from the natural features whereas the white colour represents the maximum distance from the natural features which is 848.116 metres. |
|
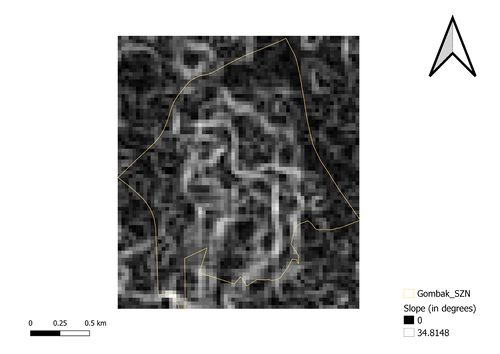
| Degrees of slope This map layout shows the degree of slope of Gombak’s planning subzone at each and every point. This is done by using GDAL’s Slope feature to get the slope of the subzone from the digital elevation model which only shows the altitude of land above sea level. The lowest degree of slope found in the planning subzone is 0 represented by the black colour and the highest degree of slope is 34.8148 degrees represented by the white colour. |


