Map Layout of Study Area
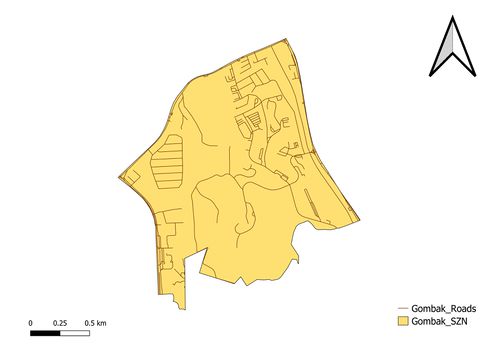
| Gombak roads This map layout shows the Gombak planning subzone with the available roads, attained by clipping the road layer from OSM and the planning subzone layer together with the road layer being the input layer and the subzone layer the clip layer. |
|
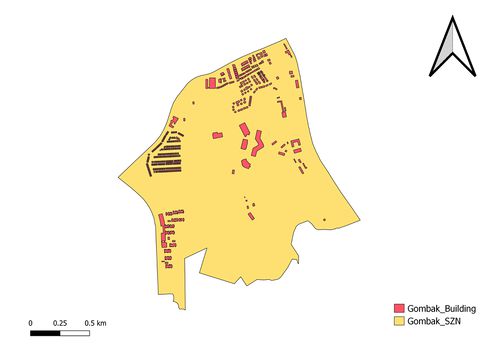
| Gombak buildings This map layout shows the Gombak planning subzone with the buildings contained in it, attained by clipping both layers with the building layer being the input layer and the subzone layer the clip layer. |
|
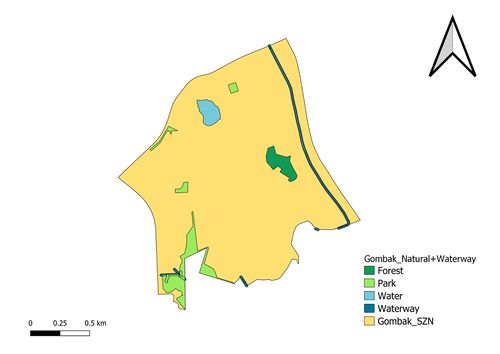
| Gombak natural features This map layout shows the Gombak planning subzone with the natural features which comprises of the forest, park and water from the Natural layer and the waterway from the waterway layer. Due the overlapping nature of the definition of waterway and natural features and since some waterway is already included in the natural layer, we want to combine the Gombak_Natural and Gombak_Waterway layer to make our analysis more accurate. Thus, the Gombak_Waterway layer needs to be converted into a polygon from a line and we can do that by buffering it. Lastly, we union the two layers to overlap it. |
|
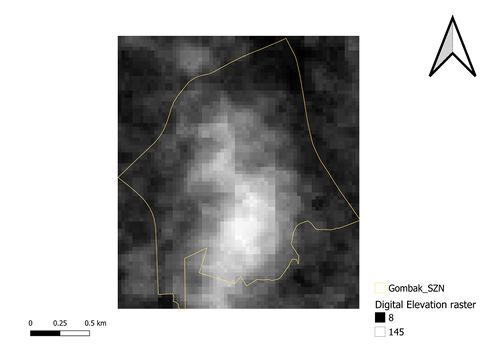
| Gombak digital elevation This map layout shows the Gombak planning subzone’s digital elevation raster layer which is just the addition of the GDEM data set downloaded from NASA’s EarthData Search site. The raster is then clipped using layer extent of the Gombak Planning subzone. The map layout shows that the black colour represents the lowest altitude of the subzone which is 8 metres above sea level and the highest altitude can go up to 145 metres above sea level which are represented as the white colour. |


