IS428 AY2019-20T1 Assign Wendy Ng Sock Ling Transformation
|
|
|
|
|
Contents
Transforming Data Given
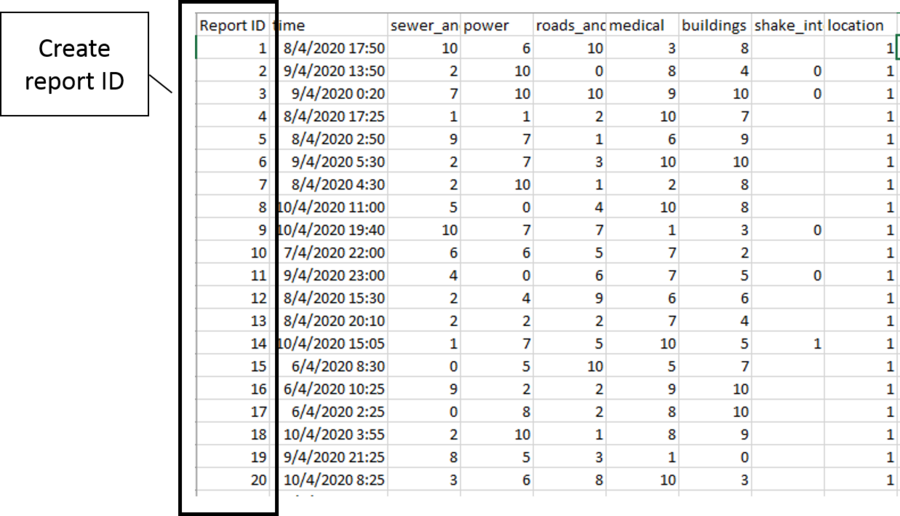
With the dataset given, the reports do not have an identifier. Hence, a Report ID column is created as seen below.
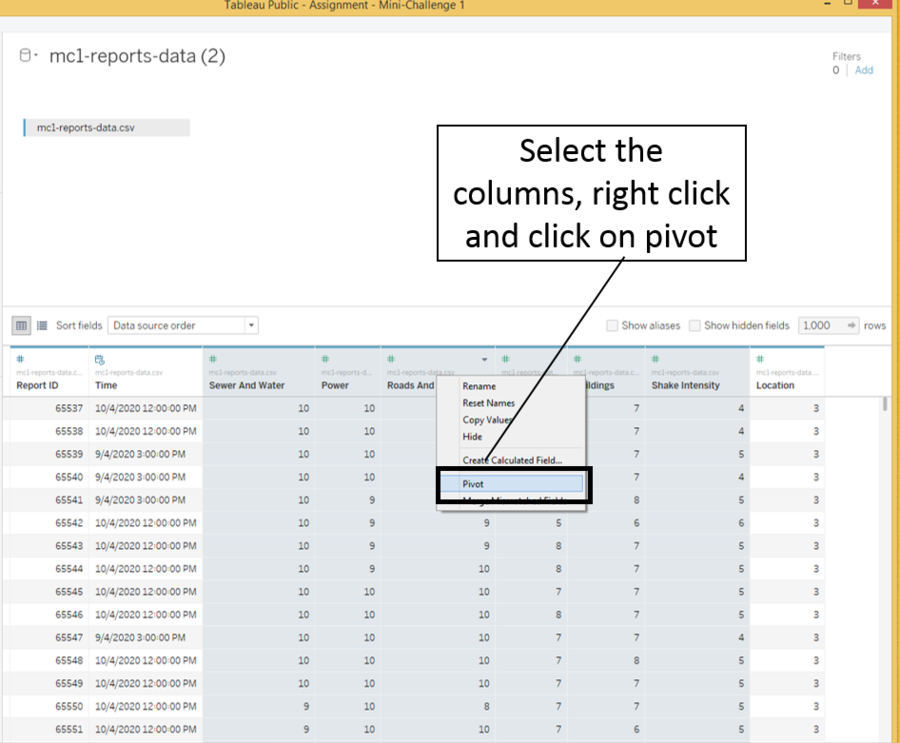
This file is then imported into tableau as a data source. Next, a pivot is done on the following columns in tableau:
- Buildings
- sewer_and_water
- power
- roads_and bridges
- medical
- shake_intensity
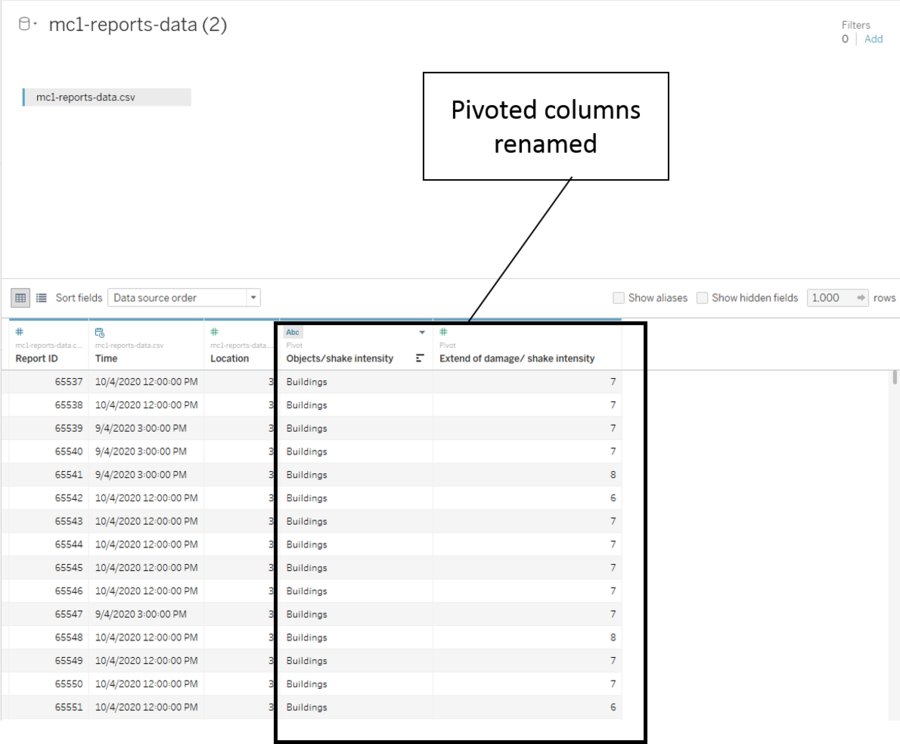
The following is the data with the columns above pivoted. The columns are then renamed as "Objects/shake intensity" and "Extend of damage/ shake intensity".
Creating An Aggregated Data Set
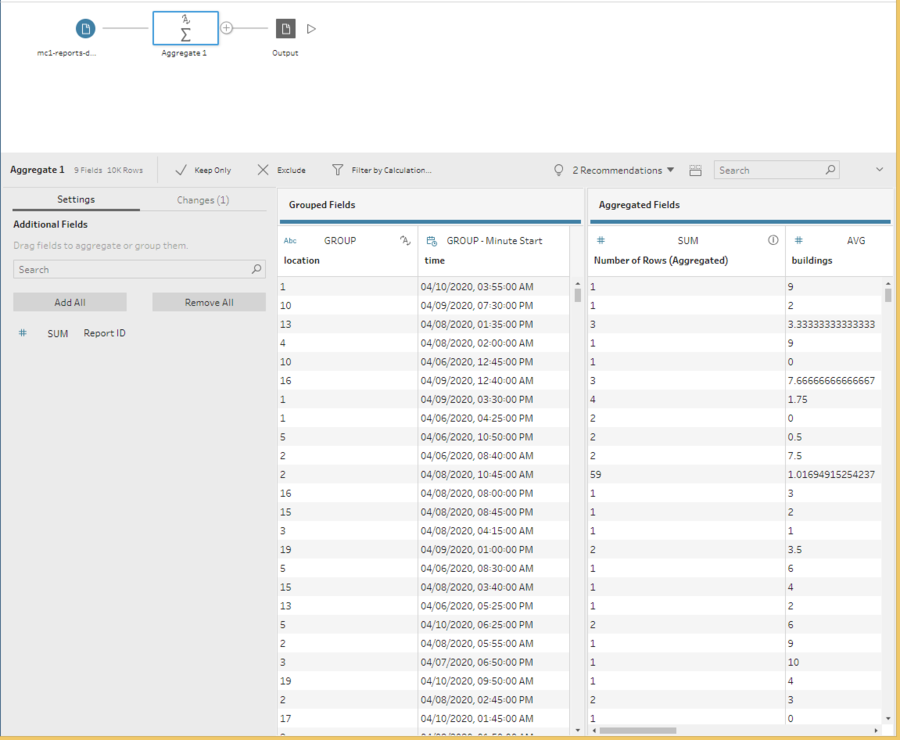
The aggregated data set is created for the ease of analysis done on the higher level where all reports for the timestamp and location are aggregated into one row. This data set is created using tableau prep where the given data is aggregated by location and time column as seen below. The following are the aggregated fields:
- Sum of the number of rows
- Average damage on the buildings
- Average damage on the medical facility
- Average damage on the power
- Average damage on the roads and bridges
- Average damage on the sewer and water
- Average shake intensity
The file is then saved as a csv output and imported into tableau as a data source.
