IS428 AY2019-20T1 Assign Wendy Ng Sock Ling Dashboard Design

From Visual Analytics for Business Intelligence
Revision as of 11:56, 13 October 2019 by Wendyng.2015 (talk | contribs)
Jump to navigation Jump to search

MC1-2019.jpg VAST Challenge 2019 MC1: Crowdsourcing for Situational Awareness

Overview

Data Transformation

Dashboard Design

Tasks

References

Dashboard link:

Description Visualization
1. Background and Navigation


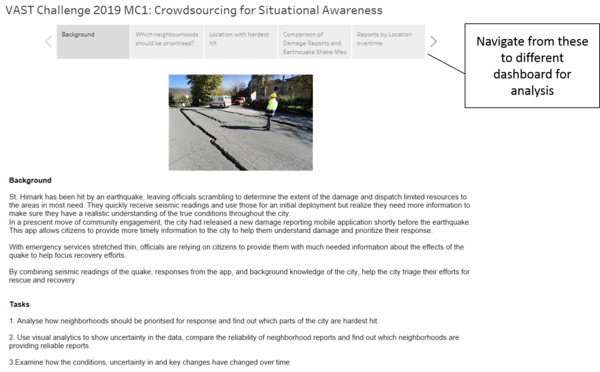
The first page shows the background and the tasks. In order to navigate to different dashboards for analysis, there are boxes at the top which are used to navigate to each dashboard for analysis.

WN Background.png
2. Which neighbourhoods should be prioritised?


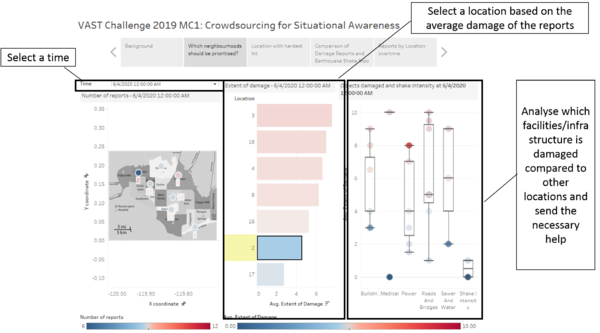
The objective of this dashboard is to identify which neighborhoods should the emergency responders prioritise given their limited resources. At each timestamp where damage reports are received, the number of reports is indicated by the size of the circles on the map (on the left). By hovering over the circle, the absolute number of reports can be seen.

The bar chart in the middle shows the average extent of damage of all reports at the time selected for each location respectively. By selecting the location, the breakdown of the damage which can be seen on the right (empty if no location is selected). The location selected will be highlighted while all other locations are at the background in order to allow comparison of the damage by the facilities/ infrastructures. By hovering over circles that are not highlighted, the location can be viewed so as to enable responders to know which location is more damaged for the respective facility/infrastructure.

For instance, in this picture the date and time "6/4/2020 12:00:00 AM" and location "2" are selected. As seen in the breakdown, although location 2 has the lowest average damage based on the bar chart, it has the highest damage on power. Hence, the responders might consider sending St. Himark's power department to location 2.

WN which neighborhoods should be prioritised.png
3. Location with hardest hit


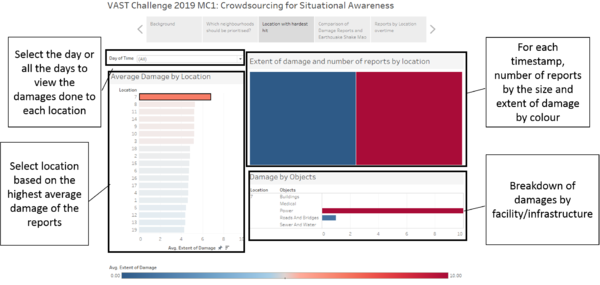
The objective of this dashboard is to identify which neighborhoods should the emergency responders prioritise given their limited resources.

WN Location with hardest hit.png
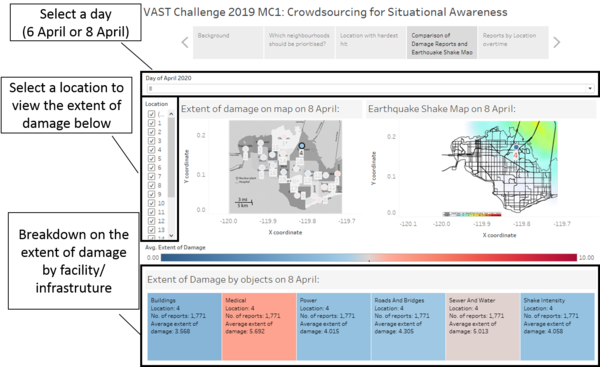
4. Comparison of damage reports and earthquake shake map


The objective of this dashboard is to identify which neighborhoods should the emergency responders prioritise given their limited resources.

WN comparison of damage reports and earthquake shake map.png
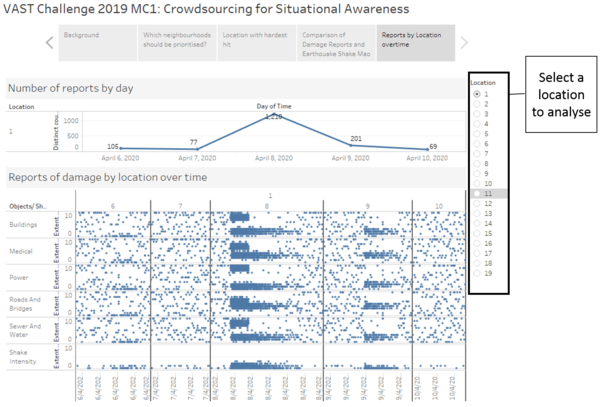
5. Reports by location over time


The objective of this dashboard is to identify which neighborhoods should the emergency responders prioritise given their limited resources.

WN Reports by location over time.png