Difference between revisions of "IS428 AY2019-20T1 Assign Ong Qian Ling PROBLEM & MOTIVATION"
Qlong.2017 (talk | contribs) |
Qlong.2017 (talk | contribs) |
||
| Line 19: | Line 19: | ||
| style=" font-size:100%; solid #1B338F; background:#808080; text-align:center;" width="20%" | | | style=" font-size:100%; solid #1B338F; background:#808080; text-align:center;" width="20%" | | ||
; | ; | ||
| − | [[IS428_AY2019-20T1_Assign_Ong_Qian_Ling_TASKS & | + | [[IS428_AY2019-20T1_Assign_Ong_Qian_Ling_TASKS & INSIGHTS| <font color="#FFFFFF">TASKS & INSIGHTS</font>]] |
|} | |} | ||
Revision as of 03:18, 13 October 2019
|
|
|
|
|
Problem & Motivation
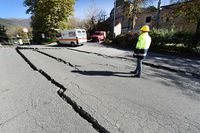
St. Himark has been hit by an earthquake, leaving officials scrambling to determine the extent of the damage and dispatch limited resources to the areas most in need. In a prescient move of community engagement, the city had released a new damage reporting mobile application shortly before the earthquake. The application allows citizens to provide more timely information in facilitating officials to understand the damage, shake intensity and prioritize the response.
However, the reliability and quality of the reports become the key concerns as the emergency planner relying heavily on the information received about the effect of the quake to help focus recovery efforts. Any false information provided, will potentially affect the decision of the emergency planner and might also risk the life of neighborhood which required more assistance.
Our main aim for this mini challenge will be to find out which neighborhood to prioritize and have the hardest hit. Also, to identify the uncertainty of data and conditions change over time.
