IS428 AY2019-20T1 Assign Ong Qian Ling DATA TRANSFORMATION PROCESS
|
|
|
|
|
Contents
Data Transformation
Before moving on to the analysis, it is always essential to analyze, clean and transform the raw data so that it can bring value to the analysis. In the zipped file, 1 datafile was given and it spans across the entire length of the event, containing (categorical) individual reports of shaking intensity/damage by neighborhood over time.
To facilitate the data cleaning and transforming process, I will be using the Tableau Prep Builder. The following section below will be a step by step explanation on how the dataset is being prepared.
Transforming the Data
Looking at the data, we can instantly identify that the data is given in a reporting format which is typically hard for visualization purposes. In order to further customize the data pertaining to each individual area of concerns of their preference, we are required to transpose the data of the 6 different categories (Building, Medical, etc.) from columns to rows.
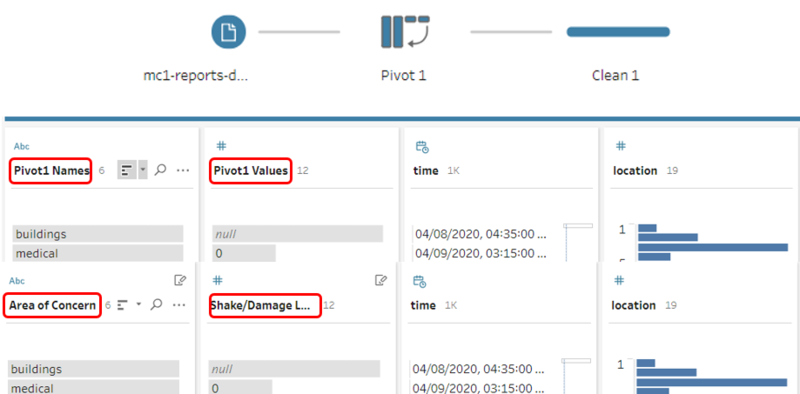
Step1: Connect the data file into Tableau Prep Builder to create a flow. Next, add the pivot step to perform the transposing of data by dragging the fields (Shake intensity, Building, Power, Roads and bridges, Sewer and Water and Medical) into the Pivot Fields Area. Upon doing so, the data will be transformed automatically from columns to rows.
Step2: After transposing the data, I added a step in the flow to clean the data. I renamed the column name Pivot1 Names and Pivot1 Values to Area of Concerns & Shake/ Damage Level respectively so as to facilitate further analysis.
Getting Neighborhood Coordinates:
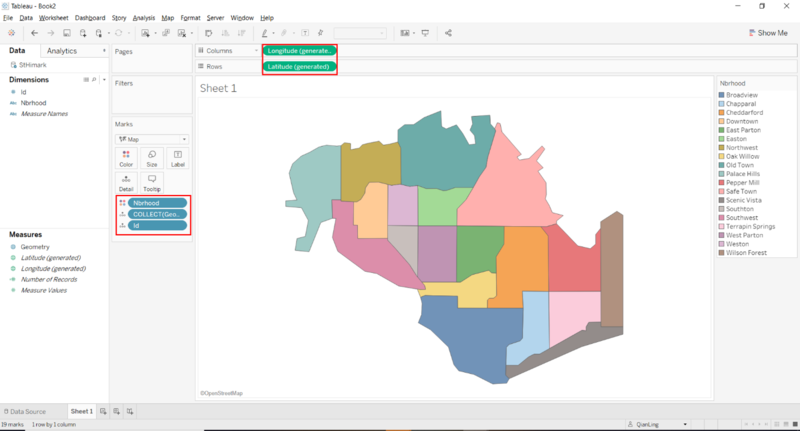
In order to showcase each and every neighborhood area in the map view, we will require the X and Y coordinates of each neighborhood. However, no coordinate points were provided in the MC1 Dataset. To resolve this problem, import the shapefile (which have created the polygons) from the MC2 zipped file into Tableau to retrieve the respective latitudes and longitudes.
Step1: Import the shapefile from MC2 into Tableau. Next, head to the worksheet view and drag the following fields into the respective areas:
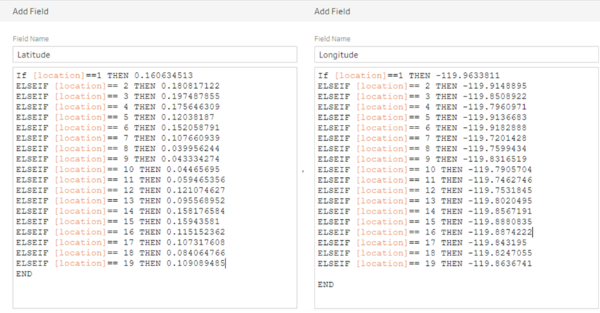
Step2: To view the coordinate of each neighborhood, right click on the white area and select view data. A window will appear and show all the latitudes and longitudes. With the coordinates found, we can now add it into the dataset file by creating two calculated fields (latitude and longitude). The calculated field formula iqs as follows:
Export the Data
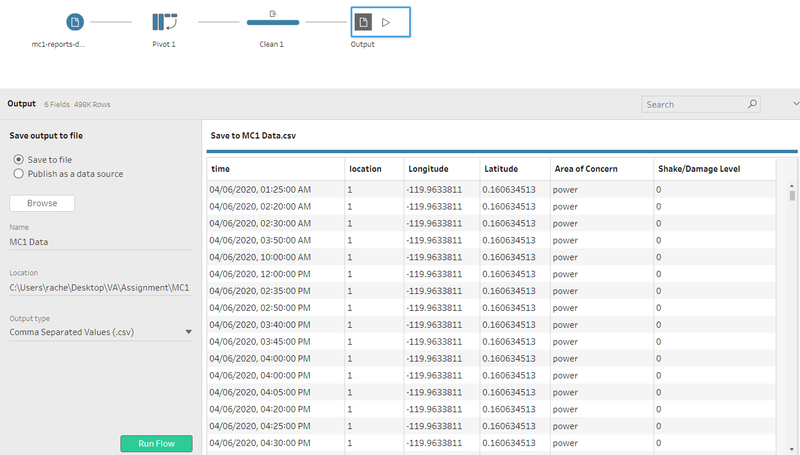
In order to save the transposed table to file, we need to then add an output step. Change the output type to csv.file and click run flow. By doing so, the file is saved, and you may utilize this file to create the necessary visualizations for this assignment.
DataSet Import Structure & Process
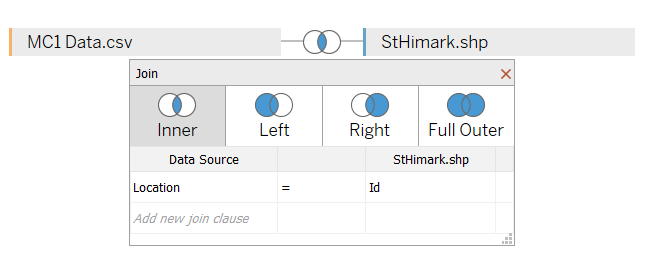
With the data transformation process completed, you may now import the following files into Tableau. To combine both files, you will need to select inner join by the unique ID column which is the Location from the transformed dataset and ID from the StHimark shapefile as shown below. Once that is completed, you may proceed with the visual analytics for this assignment.
