Difference between revisions of "IS428 AY2019-20T1 Assign Wendy Ng Sock Ling"
Wendyng.2015 (talk | contribs) |
Wendyng.2015 (talk | contribs) |
||
| Line 1: | Line 1: | ||
| + | <div style=background:#7B7D7D border:#A3BFB1> | ||
| + | [[Image:MC1-2019.jpg|180px]] | ||
| + | <b><font size = 5; color="#FFFFFF">VAST Challenge'19 MC1: Crowdsourcing for Situational Awareness</font></b> | ||
| + | </div> | ||
| + | |||
| + | {|style="background-color:##7B7D7D;" width="100%" cellspacing="0" cellpadding="0" valign="top" border="0" | | ||
| + | | style="font-family:Century Gothic; font-size:100%; solid #000000; background:#7B7D7D; text-align:center;" width="20%" | | ||
| + | ; | ||
| + | [[IS428_AY2019-20T1_Assign_Wendy_Ng_Sock_Ling| <font color="#FFFFFF">Overview</font>]] | ||
| + | | style="font-family:Century Gothic; font-size:100%; solid #1B338F; background:#7B7D7D; text-align:center;" width="20%" | | ||
| + | ; | ||
| + | [[IS428_AY2019-20T1_Assign_Wendy_Ng_Sock_Ling_Transformation| <font color="#FFFFFF">Data Transformation</font>]] | ||
| + | | style="font-family:Century Gothic; font-size:100%; solid #1B338F; background:#7B7D7D; text-align:center;" width="20%" | | ||
| + | ; | ||
| + | [[IS428_AY2019-20T1_Assign_Wendy_Ng_Sock_Ling_Dashboard_Design| <font color="#FFFFFF">Dashboard Design</font>]] | ||
| + | | style="font-family:Century Gothic; font-size:100%; solid #1B338F; background:#7B7D7D; text-align:center;" width="20%" | | ||
| + | ; | ||
| + | [[IS428_AY2019-20T1_Assign_Wendy_Ng_Sock_Ling_Tasks| <font color="#FFFFFF">Tasks</font>]] | ||
| + | | style="font-family:Century Gothic; font-size:100%; solid #1B338F; background:#7B7D7D; text-align:center;" width="20%" | | ||
| + | ; | ||
| + | [[IS428_AY2019-20T1_Assign_Wendy_Ng_Sock_Ling_References| <font color="#FFFFFF">References</font>]] | ||
| + | ; | ||
| + | |} | ||
| + | |||
| + | |||
== Assignment: To be a Visual Detective == | == Assignment: To be a Visual Detective == | ||
| Line 11: | Line 36: | ||
By combining seismic readings of the quake, responses from the app, and background knowledge of the city, help the city triage their efforts for rescue and recovery | By combining seismic readings of the quake, responses from the app, and background knowledge of the city, help the city triage their efforts for rescue and recovery | ||
| − | |||
| − | |||
| − | |||
| − | |||
| − | |||
| − | |||
| − | |||
| − | |||
| − | |||
| − | |||
| − | |||
| − | |||
| − | |||
| − | |||
| − | |||
| − | |||
Revision as of 11:32, 11 October 2019
|
|
|
|
|
|
Assignment: To be a Visual Detective
Mini-Challenge 1: Crowdsourcing for Situational Awareness
Background [1]
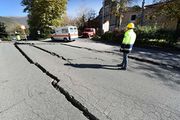
St. Himark has been hit by an earthquake, leaving officials scrambling to determine the extent of the damage and dispatch limited resources to the areas in most need. They quickly receive seismic readings and use those for an initial deployment but realize they need more information to make sure they have a realistic understanding of the true conditions throughout the city.
In a prescient move of community engagement, the city had released a new damage reporting mobile application shortly before the earthquake. This app allows citizens to provide more timely information to the city to help them understand damage and prioritize their response. In this mini-challenge, use app responses in conjunction with shake maps of the earthquake strength to identify areas of concern and advise emergency planners. Note: the shake maps are from April 6 and April 8 respectively.
With emergency services stretched thin, officials are relying on citizens to provide them with much needed information about the effects of the quake to help focus recovery efforts.
By combining seismic readings of the quake, responses from the app, and background knowledge of the city, help the city triage their efforts for rescue and recovery
