Difference between revisions of "IS428 AY2019-20T1 Assign Sin Myeong Eun Task3"
Jump to navigation
Jump to search
Mesin.2017 (talk | contribs) |
Mesin.2017 (talk | contribs) |
||
| Line 1: | Line 1: | ||
| − | <div style=background:# | + | <div style=background:#5c4d7d border:#A3BFB1> |
[[Image:Nuclearpowerplant.jpg|165px]] | [[Image:Nuclearpowerplant.jpg|165px]] | ||
<b><font size = 6; color="#FFFFFF">VAST Challenge'19 MC2:Citizen Science to the Rescue</font></b> | <b><font size = 6; color="#FFFFFF">VAST Challenge'19 MC2:Citizen Science to the Rescue</font></b> | ||
</div> | </div> | ||
| − | + | ||
| − | {|style="background-color:# | + | {|style="background-color:#5c4d7d;" width="100%" cellspacing="0" cellpadding="0" valign="top" border="0" | |
| − | | style="font-family:Century Gothic; font-size:100%; solid #000000; background:# | + | | style="font-family:Century Gothic; font-size:100%; solid #000000; background:#9a8abf; text-align:center;" width="20%" | |
; | ; | ||
[[IS428_AY2019-20T1_Assign_Sin_Myeong_Eun| <font color="#FFFFFF">Overview & Data preparation</font>]] | [[IS428_AY2019-20T1_Assign_Sin_Myeong_Eun| <font color="#FFFFFF">Overview & Data preparation</font>]] | ||
| − | | style="font-family:Century Gothic; font-size:100%; solid #1B338F; background:# | + | | style="font-family:Century Gothic; font-size:100%; solid #1B338F; background:#9a8abf; text-align:center;" width="20%" | |
; | ; | ||
[[IS428_AY2019-20T1_Assign__Sin_Myeong_Eun_Tasks| <font color="#FFFFFF">Tasks</font>]] | [[IS428_AY2019-20T1_Assign__Sin_Myeong_Eun_Tasks| <font color="#FFFFFF">Tasks</font>]] | ||
| − | | style="font-family:Century Gothic; font-size:100%; solid #1B338F; background:# | + | | style="font-family:Century Gothic; font-size:100%; solid #1B338F; background:#9a8abf; text-align:center;" width="20%" | |
[[IS428_AY2019-20T1_Assign__Sin_Myeong_Eun_InteractiveVisualisation| <font color="#FFFFFF">Interactive Visualisation</font>]] | [[IS428_AY2019-20T1_Assign__Sin_Myeong_Eun_InteractiveVisualisation| <font color="#FFFFFF">Interactive Visualisation</font>]] | ||
| − | | style="font-family:Century Gothic; font-size:100%; solid #1B338F; background:# | + | | style="font-family:Century Gothic; font-size:100%; solid #1B338F; background:#9a8abf; text-align:center;" width="20%" | |
; | ; | ||
[[IS428_AY2019-20T1_Assign__Sin_Myeong_Eun_References| <font color="#FFFFFF">References</font>]] | [[IS428_AY2019-20T1_Assign__Sin_Myeong_Eun_References| <font color="#FFFFFF">References</font>]] | ||
; | ; | ||
|} | |} | ||
| + | |||
<!--Sub Header--> | <!--Sub Header--> | ||
| − | {| style="background-color:# | + | {| style="background-color:#c3b1e0; font-size:14px; text-align:center;padding: 0px 0 0 0;" width="100%" height=50px cellspacing="0" cellpadding="0" valign="top" border="0" | |
<!-- Current Page --> | <!-- Current Page --> | ||
| style="vertical-align:top;width:20%;" | <div style="padding: 3px; line-height: wrap_content; border-bottom:5px #3D5480; font-family:Century Gothic"> [[IS428_AY2019-20T1_Assign_Sin_Myeong_Eun_Tasks |<font color =#FFFFFF >Task 1</font>]] | | style="vertical-align:top;width:20%;" | <div style="padding: 3px; line-height: wrap_content; border-bottom:5px #3D5480; font-family:Century Gothic"> [[IS428_AY2019-20T1_Assign_Sin_Myeong_Eun_Tasks |<font color =#FFFFFF >Task 1</font>]] | ||
| Line 31: | Line 32: | ||
| style="vertical-align:top;width:20%;" | <div style="padding: 3px; line-height: wrap_content; border-bottom:1px; font-family:Century Gothic"> [[IS428_AY2019-20T1_Assign_Sin_Myeong_Eun_Task5 | <font color =#FFFFFF >Task 5</font>]] | | style="vertical-align:top;width:20%;" | <div style="padding: 3px; line-height: wrap_content; border-bottom:1px; font-family:Century Gothic"> [[IS428_AY2019-20T1_Assign_Sin_Myeong_Eun_Task5 | <font color =#FFFFFF >Task 5</font>]] | ||
|} | |} | ||
| − | |||
=== Task 3: Given the uncertainty you observed in question 2, are the radiation measurements reliable enough to locate areas of concern? === | === Task 3: Given the uncertainty you observed in question 2, are the radiation measurements reliable enough to locate areas of concern? === | ||
==== a) Highlight potential locations of contamination, including the locations of contaminated cars. Should St. Himark officials be worried about contaminated cars moving around the city? ==== | ==== a) Highlight potential locations of contamination, including the locations of contaminated cars. Should St. Himark officials be worried about contaminated cars moving around the city? ==== | ||
Revision as of 18:39, 10 October 2019
 VAST Challenge'19 MC2:Citizen Science to the Rescue
|
|
|
|
Contents
- 1 Task 3: Given the uncertainty you observed in question 2, are the radiation measurements reliable enough to locate areas of concern?
- 1.1 a) Highlight potential locations of contamination, including the locations of contaminated cars. Should St. Himark officials be worried about contaminated cars moving around the city?
- 1.2 b) Estimate how many cars may have been contaminated when coolant leaked from the Always Safe plant. Use visual analysis of radiation measurements to determine if any have left the area.
- 1.3 c) Indicated where you would deploy more sensors to improve radiation monitoring in the city. Would you recommend more static sensors or more mobile sensors or both? Use your visualization of radiation measurement uncertainty to justify your recommendation.
Task 3: Given the uncertainty you observed in question 2, are the radiation measurements reliable enough to locate areas of concern?
a) Highlight potential locations of contamination, including the locations of contaminated cars. Should St. Himark officials be worried about contaminated cars moving around the city?

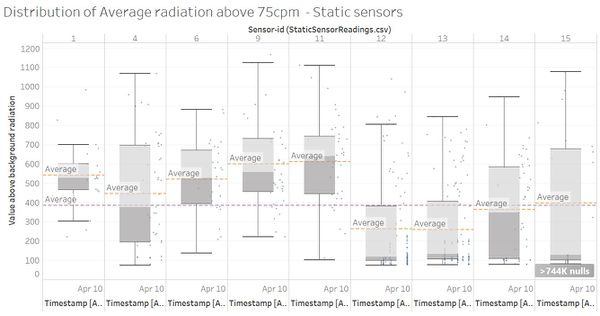
Figure 3a
- In order to locate the areas that were highly contaminated, we need to study the distribution of each static sensor. A new field had to be created to contain only the readings that were above 75cpm, meaning we just want to study the readings that do not only consist of the background radiation. The new field was computed using the following equation: "if(avg([Value])>75) THEN avg([Value]) END".
- Moving on, boxplot was chosen as a visualisation method to show the distribution of each static sensor's readings. From figure 2b, we can compare the average value of each sensor's readings to the average value of the all the sensors' readings.
- By manual comparison, we can see that sensors with sensor ID 1,4,6,9,11 are the sensors that detected higher average reading than the overall average reading. Sensor 15 was not chosen because its average reading was too sensitive to the outliers when most of its data points lie below the overall average reading.
- By comparing with the shake map that shows the region where each static sensor is located at, we can deduce that the following list of regions are the potential locations of contamination.
- Sensor ID 1: Palace Hills
- Sensor ID 4: DownTown
- Sensor ID 6: SouthWest
- Sensor ID 9: Old Town
- Sensor ID 11: Broadview
b) Estimate how many cars may have been contaminated when coolant leaked from the Always Safe plant. Use visual analysis of radiation measurements to determine if any have left the area.