IS428 AY2019-20T1 Assign Sin Myeong Eun Task4
|
|
|
|
Task 4: Summarize the state of radiation measurements at the end of the available period. Use your novel visualizations and analysis approaches to suggest a course of action for the city. Use visual analytics to compare the static sensor network to the mobile sensor network. What are the strengths and weaknesses of each approach? How do they support each other?
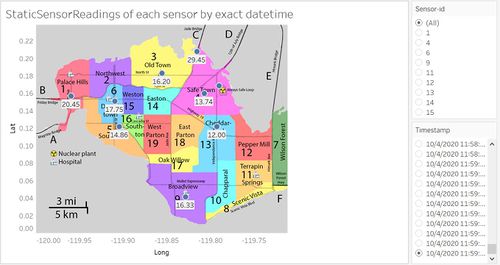
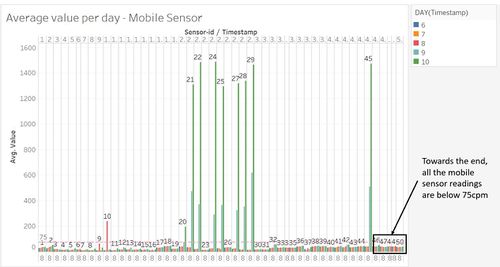
At the end of the available period, both sensor readings are below 75cpm, thus returning back to the safety level. This is evident in figure 4-1 and 4-2 for static and mobile sensors respectively.
Figure 4-1
Figure 4-2
St.Himark's emergency team should look into increasing the number of both sensors due to the reasons that were elaborated in Task 3. Both types of sensors should be utilised together because both sensors have their own pros and cons and they can complement each other. For example, static sensors are unable to cover all boundaries of each region but this issue can be resolved with mobile sensors. Mobile sensors' high uncertainties can be mitigated by the use of static sensors which are of higher stability than mobile sensors. Moreover, the sensor readings should be monitored continuously although the readings at the end of 10th April have gone down. For the contaminated cars, the drivers should be warned not to leave St.Himark until they have decontaminated their cars as we do not want the contaminated cars to cause further contamination in other cities by traveling away from St.Himark.


