 VAST Challenge'19 MC2:Citizen Science to the Rescue
Task 1: Visualize radiation measurements over time from both static and mobile sensors to identify areas where radiation over background is detected. Characterize changes over time.
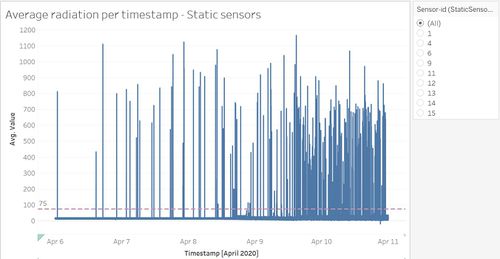
According to prior research, it is stated that normal background radiation level is typically below 75 counts per minute(cpm). Thus, in this study, any radiation record that is lower than 75cpm will be regarded as background radiation whereas those that are higher than 75cpm will be regarded as radiation that consists of radiation leak due to the earthquake.
| Sensor Type |
Changes |
Evidence |
| Static Sensors |
By studying the average radiation level per timestamp graph, it is evident that the number of occurrences where the radiation level recorded by static sensors is greater than 75cpm increases with time. |
 |
| Mobile Sensors |
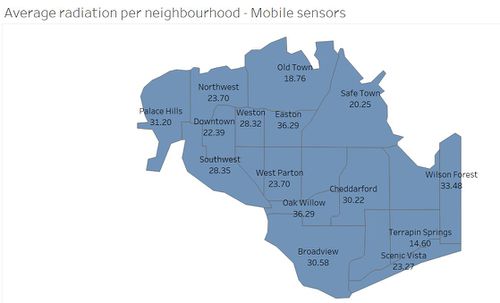
Generally, mobile sensors detect radiation that is lower than 75cpm, which means that the radiation that was recorded by citizen-operated sensors are mainly background radiation. |
 |
| The neighbourhood with the greatest average radiation is Oak Willow. |
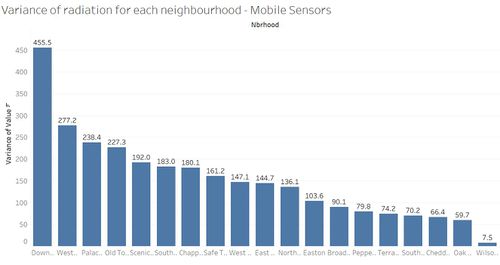
| The neighbourhood with highest variance in its radiation recordings is Downtown, whereas the one with the lowest variance is Wilson Forest. The possible reason as to why Wilson Forest has the lowest variance could be due to the fact that the particular neighbourhood is a wooded area bounded by extensive greenery, which can help to block or reduce the radiation. Thus, even when there’s radiation leak due to the earthquake, the radiation level in Wilson Forest might not fluctuate as much as other areas such as Downtown. As for Downtown, the area has numerous hospitals and thus will be highly concentrated with background radiation from various medical tests. Such cases could result in high fluctuations in the radiation at Downtown. |
 |


