IS428 AY2019-20T1 Assign Sin Myeong Eun Task3
 VAST Challenge'19 MC2:Citizen Science to the Rescue
|
|
|
|
Contents
- 1 Task 3: Given the uncertainty you observed in question 2, are the radiation measurements reliable enough to locate areas of concern?
- 1.1 a) Highlight potential locations of contamination, including the locations of contaminated cars. Should St. Himark officials be worried about contaminated cars moving around the city?
- 1.2 b) Estimate how many cars may have been contaminated when coolant leaked from the Always Safe plant. Use visual analysis of radiation measurements to determine if any have left the area.
- 1.3 c) Indicate where you would deploy more sensors to improve radiation monitoring in the city. Would you recommend more static sensors or more mobile sensors or both? Use your visualization of radiation measurement uncertainty to justify your recommendation.
Task 3: Given the uncertainty you observed in question 2, are the radiation measurements reliable enough to locate areas of concern?
a) Highlight potential locations of contamination, including the locations of contaminated cars. Should St. Himark officials be worried about contaminated cars moving around the city?

Figure 3a-1
- In order to locate the areas that were highly contaminated, we need to study the distribution of each static sensor. A new field had to be created to contain only the readings that were above 75cpm, meaning we just want to study the readings that do not only consist of the background radiation. The new field was computed using the following equation: "if(avg([Value])>75) THEN avg([Value]) END".
- Moving on, boxplot was chosen as a visualisation method to show the distribution of each static sensor's readings. From figure 3a-1, we can compare the average value of each sensor's readings to the average value of the all the sensors' readings.
- By manual comparison, we can see that sensors with sensor ID 1,4,6,9,11 are the sensors that detected higher average reading than the overall average reading. Sensor 15 was not chosen because its average reading was too sensitive to the outliers when most of its data points lie below the overall average reading.
- By comparing with the shake map that shows the region where each static sensor is located at, we can deduce that the following list of regions are the potential locations of contamination.
- Sensor ID 1: Palace Hills
- Sensor ID 4: DownTown
- Sensor ID 6: SouthWest
- Sensor ID 9: Old Town
- Sensor ID 11: Broadview

Figure 3a-2
- In order to locate the locations of contaminated cars,we have to visualise the movement of the cars whose mobile sensors detected readings higher than 75cpm. Firstly, refer to figure 3a-2 which shows the average readings of all the mobile sensors across the time span, sorted by their sensor-id. We will have to focus on the "spikes" shown on 3a-2, which are the readings that were higher than 75cpm (highest background radiation) as those sensors are the ones that detected high radiation records. The following list is the mobile sensors that were identified to have detected high radiation readings.
-
Sensor IDs:
- 10
- 20
- 21
- 22
- 24
- 25
- 27
- 28
- 29
- 45
- Next, with the identified sensors, we analyse their movements across the city. Figure 3a-3 below is an example of how the movement of highly contaminated car can be visualised using the sensor-id filter. This step will be repeated for all sensors listed as highly contaminated from previous step.
- DownTown
- Weston
- Easton
- Old Town
- Southwest
- Southton
- West Parton
- Oak Willow
- Broadview
- Chapparal
- Scenic Vista
- Palace Hills: 0
- Northwest: 0
- Old Town: 1
- Safe Town: 2
- Southwest:
- DownTown
- Wilson Forest: 0
- Scenic Vista: 2
- Broadview: 6
- Chapparal: 5
- Terrapin Springs: 3
- Pepper Mill: 0
- Cheddarford: 3
- Easton: 2
- Weston: 1
- Southton: 2
- Oak Willow: 5
- East Parton: 4
- West Parton: 5
- DownTown
- Southton
- West Parton
- East Parton
- Oak Willow
- Broadview
- DownTown
- Cheddarford
- Chapparal
- DownTown
- Weston
- Southton
- Southwest
- West Parton
- Oak Willow
- Broadview
- Scenic Vista
- Easton
- Safe Town
- East Parton
- Cheddarford
- Terrapin Springs
- Broadview
- Scenic Vista
- Chapparal
- East Parton
- Safe Town
- Cheddarford
- Chapparal
- Scenic Vista
- Terrapin Springs
- Scenic Vista
- West Parton
- Oak Willow
- Broadview
- Scenic Vista
- Safe Town
- East Parton
- West Parton
- Oak Willow
- Broadview
- Chapparal
- Terrapin Springs
- Identify the location when the "spike" in radiation reading was spotted by the car. From Figure 3b-1 below, we know that the day when the car was contaminated heavily was 8th April.
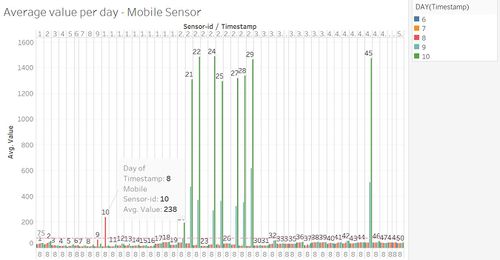
Figure 3b-1
- Next, we need to study whether the car has left the area from 8th April onwards. From Figure 3b-2 below, we can see that on 8th April, the car did not leave Old Town.
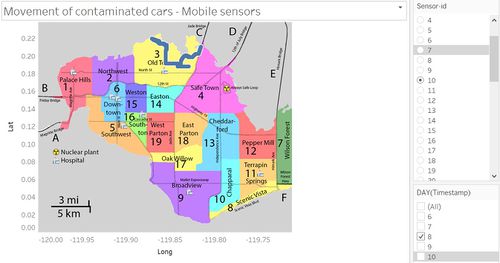
Figure 3b-2
However, according to 3b-3, from 8th April to 10th April, the car did not remain within the boundaries of Old Town and traveled to other regions, thus causing contamination to other areas as well.
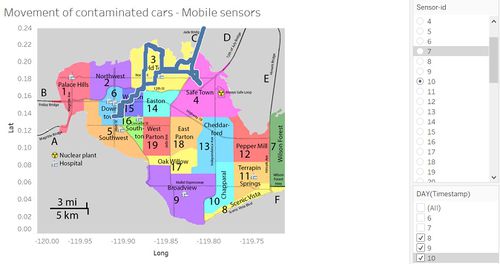
Figure 3b-3

Figure 3a-3
| Sensor ID | Regions traveled | Sensor ID | Regions traveled | Overall Regions frequency |
|---|---|---|---|---|
| 10 | 25 |
|
||
| 20 | 27 | |||
| 21 | 28 | |||
| 22 | 29 | |||
| 24 | 45 |
Based on the above findings, we can deduce that the top 5 regions with the highest frequency of contaminated cars are Broadview, Chapparal, Oak Willow, East Parton and West Parton.
St.Himark officials should be worried about contaminated cars moving around the city. The contaminated cars can cause second round of contamination at the regions that they travel to, which could result in uncertainties in the readings of static sensors when the contaminated cars are within the area of coverage of the static sensors. In such scenario, static sensor readings will not show the pure readings of the radiation level of the region but also the fluctuations due to the contaminated cars.
b) Estimate how many cars may have been contaminated when coolant leaked from the Always Safe plant. Use visual analysis of radiation measurements to determine if any have left the area.
According to the answer to Task 3a, the sensor IDs of contaminated cars are as follows: 10,20,21,22,24,25,27,28,29,45. There were 10 contaminated cars when coolant leaked from the power plant. Referring back to Figure 3a-2 and 3a-3 and using appropriate filters, we can deduce the movement of each contaminated car. Let's take car with sensor ID 10 as an example for the step-by-step procedure.


The above steps were followed for the rest of the contaminated cars. Based on the observations from visualisations, cars with sensor IDs 10,24,25,28,29 and 45 were seen to have left the location at which they were spotted at the time of contamination. The rest of the cars did not.
c) Indicate where you would deploy more sensors to improve radiation monitoring in the city. Would you recommend more static sensors or more mobile sensors or both? Use your visualization of radiation measurement uncertainty to justify your recommendation.
I will definitely have to consider deploying more static sensors at relevant areas. Refer to Figure 3c-1 below, which was previously used for Task 2 to measure the uncertainty.

Figure 3c-1
According to my answer to Task 2b, Palace Hills, Southwest and Cheddarford are the regions of higher uncertainties, which were previously justified in Task 2b answer. Therefore, I will place more static sensors so that more areas of these regions are covered by the static sensor. For Palace Hills, one or two more static sensors nearer to the hospital area to take into consideration the radiation readings that can be detected near the hospitals. For Southwest, one static sensor can be placed at the northern part of the region and another at the southern part, so as to cover other parts of the region, and not just the current one which might take in radiation readings from other neighbourhoods. As for Cheddarford, one more static sensor can be placed at the southern area of the region and it is important to consider the readings of Cheddarford as the region is located within close proximity to the power plant. Mobile sensors are also essential to the team because the data from mobile sensors can be used to analyse how the contamination has been spread to other areas which weren't covered by static sensors as there are some regions with no static sensors at all. However, it is important to take note of the fact that more static sensors have to be placed than mobile sensors as we need to remember that there are some regions with no static sensors, such as Northwest and Easton.