Difference between revisions of "IS428 AY2019-20T1 Assign Sin Myeong Eun Task2"
Mesin.2017 (talk | contribs) |
Mesin.2017 (talk | contribs) |
||
| Line 1: | Line 1: | ||
| − | <div style=background:# | + | <div style=background:#5c4d7d border:#A3BFB1> |
[[Image:Nuclearpowerplant.jpg|165px]] | [[Image:Nuclearpowerplant.jpg|165px]] | ||
<b><font size = 6; color="#FFFFFF">VAST Challenge'19 MC2:Citizen Science to the Rescue</font></b> | <b><font size = 6; color="#FFFFFF">VAST Challenge'19 MC2:Citizen Science to the Rescue</font></b> | ||
</div> | </div> | ||
| − | + | ||
| − | {|style="background-color:# | + | {|style="background-color:#5c4d7d;" width="100%" cellspacing="0" cellpadding="0" valign="top" border="0" | |
| − | | style="font-family:Century Gothic; font-size:100%; solid #000000; background:# | + | | style="font-family:Century Gothic; font-size:100%; solid #000000; background:#9a8abf; text-align:center;" width="20%" | |
; | ; | ||
[[IS428_AY2019-20T1_Assign_Sin_Myeong_Eun| <font color="#FFFFFF">Overview & Data preparation</font>]] | [[IS428_AY2019-20T1_Assign_Sin_Myeong_Eun| <font color="#FFFFFF">Overview & Data preparation</font>]] | ||
| − | | style="font-family:Century Gothic; font-size:100%; solid #1B338F; background:# | + | | style="font-family:Century Gothic; font-size:100%; solid #1B338F; background:#9a8abf; text-align:center;" width="20%" | |
; | ; | ||
[[IS428_AY2019-20T1_Assign__Sin_Myeong_Eun_Tasks| <font color="#FFFFFF">Tasks</font>]] | [[IS428_AY2019-20T1_Assign__Sin_Myeong_Eun_Tasks| <font color="#FFFFFF">Tasks</font>]] | ||
| − | | style="font-family:Century Gothic; font-size:100%; solid #1B338F; background:# | + | | style="font-family:Century Gothic; font-size:100%; solid #1B338F; background:#9a8abf; text-align:center;" width="20%" | |
[[IS428_AY2019-20T1_Assign__Sin_Myeong_Eun_InteractiveVisualisation| <font color="#FFFFFF">Interactive Visualisation</font>]] | [[IS428_AY2019-20T1_Assign__Sin_Myeong_Eun_InteractiveVisualisation| <font color="#FFFFFF">Interactive Visualisation</font>]] | ||
| − | | style="font-family:Century Gothic; font-size:100%; solid #1B338F; background:# | + | | style="font-family:Century Gothic; font-size:100%; solid #1B338F; background:#9a8abf; text-align:center;" width="20%" | |
; | ; | ||
[[IS428_AY2019-20T1_Assign__Sin_Myeong_Eun_References| <font color="#FFFFFF">References</font>]] | [[IS428_AY2019-20T1_Assign__Sin_Myeong_Eun_References| <font color="#FFFFFF">References</font>]] | ||
; | ; | ||
|} | |} | ||
| + | |||
<!--Sub Header--> | <!--Sub Header--> | ||
| − | {| style="background-color:# | + | {| style="background-color:#c3b1e0; font-size:14px; text-align:center;padding: 0px 0 0 0;" width="100%" height=50px cellspacing="0" cellpadding="0" valign="top" border="0" | |
<!-- Current Page --> | <!-- Current Page --> | ||
| style="vertical-align:top;width:20%;" | <div style="padding: 3px; line-height: wrap_content; border-bottom:5px #3D5480; font-family:Century Gothic"> [[IS428_AY2019-20T1_Assign_Sin_Myeong_Eun_Tasks |<font color =#FFFFFF >Task 1</font>]] | | style="vertical-align:top;width:20%;" | <div style="padding: 3px; line-height: wrap_content; border-bottom:5px #3D5480; font-family:Century Gothic"> [[IS428_AY2019-20T1_Assign_Sin_Myeong_Eun_Tasks |<font color =#FFFFFF >Task 1</font>]] | ||
Latest revision as of 18:39, 10 October 2019
|
|
|
|
Contents
- 1 Task 2: Represent uncertainty in the measurement of radiation across the city
- 1.1 a) Compare uncertainty of the static sensors to the mobile sensors. What anomalies can you see? Are there sensors that are too uncertain to trust?
- 1.2 b) Which regions of the city have greater uncertainty of radiation measurement? Use visual analytics to explain your rationale.
- 1.3 c) What effects do you see in the sensor readings after the earthquake and other major events? What effect do these events have on uncertainty?
Task 2: Represent uncertainty in the measurement of radiation across the city
a) Compare uncertainty of the static sensors to the mobile sensors. What anomalies can you see? Are there sensors that are too uncertain to trust?
b) Which regions of the city have greater uncertainty of radiation measurement? Use visual analytics to explain your rationale.
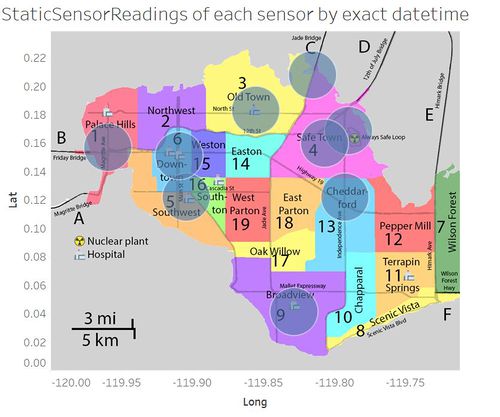
Figure 2b
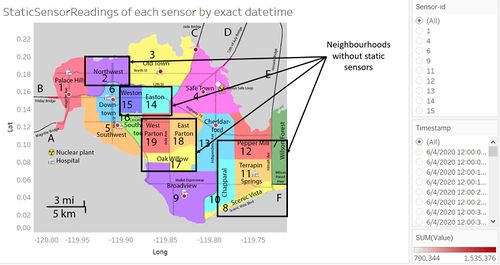
Assume that all the static sensors in St.Himark capture the same circular area of radiation and consider all the regions as long as the static sensors are able to capture the radiation of the region, regardless of the absence of sensors within the region. In the answer to this question, the following list of regions were excluded in the analysis due to the fact that these regions had close to zero coverage by any static sensors nearby.
- Northwest
- Easton
- Weston
- Southton
- West Parton
- East Parton
- Oak Willow
- Pepper Mill
- Terrapin Springs
- Chapparal
- Scenic Vista
- Wilson Forest
After excluding the regions in the above list, we now proceed to study the rest of the regions. The circular area shown in Figure 2b is an arbitrary constant value of a constant circular area that is covered by every static sensor, which shows roughly how much of each region is covered by the sensor regardless of how small or big the region is.
- Palace Hills:
- About half the region can be covered, and the covered area excludes the area where the region's hospitals are located at, which is potentially the area with greater fluctuations in radiation level due to the hospitals' extensive usage of medical tests. This could lead to lower radiation level being detected as compared to the actual radiation level, thus resulting in higher error or uncertainties in the data collected.
- Old Town:
- Being a town with relatively larger landspace, only its central area is covered by the sensor, but the area covered is inclusive of the area where hospitals are potentially located at. Thus, the radiation level detected at Old Town should be of lower uncertainties since the sensor is able to detect the fluctuations arising from the presence of hospitals.
- Moreover, there is another static sensor located between Old Town and Safe Town which covers the north-east boundary of Old Town which is nearer to the nuclear power plant. Thus, the overall recordings from static sensors will include both the fluctuations due to the hospitals and the power plant.
- Safe Town:
- This neighbourhood has two static sensors within the region itself, and the area covered by the sensors is inclusive of the area where St.Himark's nuclear power plant is located at. The recordings from Safe Town's sensors can be regarded to have relatively lower uncertainties as the readings will take into account of the radiation leak from the power plant.
- Similar to the second point under Old Town, there is one sensor located in between Old Town and Safe Town which can detect the radiation of the northern area of Safe Town.
- Overall, the sensors at Safe Town should be sufficient to detect relatively accurate readings with low uncertainties.
- SouthWest:
- Similar to Old Town, the area covered is inclusive of the area where hospitals are potentially located at. Thus, the radiation level detected at SouthWest should be of lower uncertainties since the sensor is able to detect the fluctuations arising from the presence of hospitals.
- However, its regional sensor is located in the position such that it has high possibility of detecting the radiation level of its surrounding neighbourhoods like DownTown and Southton. This could cause a crucial error in SouthWest sensor readings because both DownTown and Southton have hospitals with high radiation emission, thus causing higher uncertainties as to whether the data from SouthWest sensor comprises mainly the regional data or not.
- DownTown:
- The sensor located within DownTown is able to detect fluctuations in the readings due to the presence of hospitals in the region.
- Moreover, the sensor located at SouthWest is able to cover the southern area of DownTown, thus capturing the areas that could not be covered by the regional sensor at DownTown.
- Although the sensor at DownTown might record radiation level at Weston if the circular coverage of the sensor is wide enough, majority of the readings should comprise of DownTown data as the potential coverage of Weston readings will be negligible as compared to that of DownTown coverage.
- Overall, the readings at DownTown should be of lower uncertainties.
- Broadview:
- The regional sensor is located at the heart of Broadview, where the hospitals are. Thus, the sensor should be able to capture the fluctuations due to the presence of hospitals at the region which will be one of the major factors that contribute to the fluctuations. Thus, the readings recorded at Broadview should be relatively more accurate, resulting in lower uncertainties.
- Cheddarford:
- Being a neighbourhood nearby Safe Town where the nuclear power plants are located at, the regional sensor should be able to detect majority of the region's radiation level. However, as shown in figure 2b, the only regional sensor is located at the northern part of Cheddarford and neglects the southern area's radiation readings. Since Cheddarford's radiation readings do not consist of readings of the southern area, there should be higher uncertainties in its sensor readings.
c) What effects do you see in the sensor readings after the earthquake and other major events? What effect do these events have on uncertainty?
The earthquake will cause major solid liquefaction which will lead to the collapse of buildings. When such scenarios occur, the collapse of buildings could possibly cause the readings detected by the regional sensor to fluctuate due to the sudden change in the atmosphere, and cause uncertainties as the readings would not solely consist of readings of radiation leak from the power plant or from the hospitals.


