Difference between revisions of "IS428 AY2019-20T1 Assign Chua Xuan Ni, Rachel DASHBOARDS"
Jump to navigation
Jump to search
| Line 29: | Line 29: | ||
== Dashboard Link == | == Dashboard Link == | ||
| − | The link of the visualization can be found here: https://public.tableau.com/profile/rachel.chua#!/vizhome/IS428_MiniChallenge1_rachel_chua_2017/HOME | + | The link of the visualization can be found here: https://public.tableau.com/profile/rachel.chua#!/vizhome/IS428_MiniChallenge1_rachel_chua_2017/HOME. Please view the visualization on the link, instead of using the pictures below for the clearest visualization. |
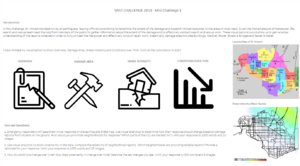
== Dashboard 1: Home Page == | == Dashboard 1: Home Page == | ||
| Line 38: | Line 38: | ||
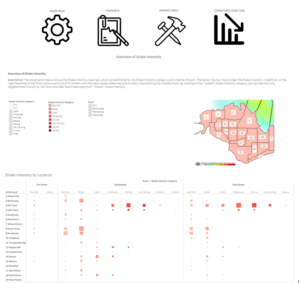
== Dashboard 3: Overview of Shake Intensity == | == Dashboard 3: Overview of Shake Intensity == | ||
| − | + | [[File:Rachel.chua.2017 Shake intensity.png|frameless|center]] | |
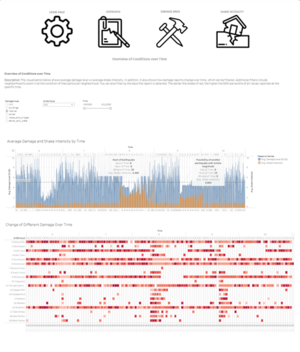
== Dashboard 4: Conditions over Time == | == Dashboard 4: Conditions over Time == | ||
| + | [[File:Rachel.chua.2017 conditions over time.png|frameless|center]] | ||
Revision as of 21:23, 11 October 2019
 IS428 VAST 2019 Mini Challenge 1
|
|
|
|
|
|
Contents
Dashboard Link
The link of the visualization can be found here: https://public.tableau.com/profile/rachel.chua#!/vizhome/IS428_MiniChallenge1_rachel_chua_2017/HOME. Please view the visualization on the link, instead of using the pictures below for the clearest visualization.
Dashboard 1: Home Page

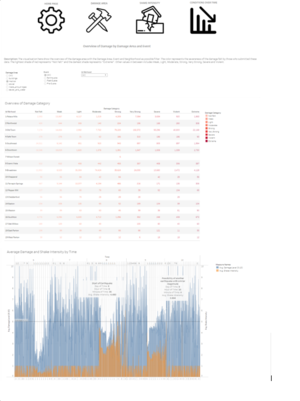
Dashboard 2: Overview of Damage Area

Dashboard 3: Overview of Shake Intensity

Dashboard 4: Conditions over Time
