IS428 AY2019-20T1 Assign Chua Xuan Ni, Rachel DATA TRANSFORMATION
|
|
|
|
|
|
Contents
Dataset Analysis & Transformation Process
| Issue | Solution |
|---|---|
| Issue 1: In the current dataset, “mc1-reports-data.csv”. The different categories of damage are a column by itself, making it difficult to compare the damage by the categories. | Pivot the different categories of damage – sewer_and_water, power, roads_and_bridges, medical and buildings into a new column, “Damage Area”, with their respective damage level in a new column, “Damage Level (0-10)”. To do this, I used Tableau Prep’s “Pivot function” to make the changes. After applying the pivot function, you can see that I now have 2 new columns containing the data from sewer_and_water, power, roads_and_bridges, medical and buildings merged as one. |
| Issue 2: In the given data – mc1-majorquake-shakemap.png, we can see that each value of Damage Level from 1 to 10 is categorized into the perceived shaking and we should align the values of each damage level as per the perceived shaking as well. | As seen from the data, damage level has 0 as well, but the perceived shaking does not include 0. However, since 1 is categorized as “not felt”, 0 should fit into this category as well since it is the mildest possible perceived shaking level. To do this, I have created a new calculated field / column, “Damage Category”, to bin all the values respectively (ie. damage level between 0-1 == “Not Felt”, damage level between 2-3 == “Weak”, damage level 4 == “Light”, damage level 5 == “Moderate”, damage level 6 == “Strong”, damage level 7 == “Very Strong”, damage level 8 == “Severe”, damage level 9 == “Violent” and damage level 10 == “Extreme”). Do the same for shake intensity and create a new calculated field/column, “Shake Intensity Category”. |
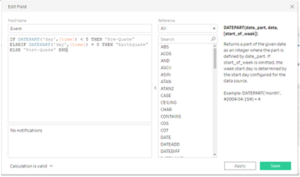
| Issue 3: Since we know that the earthquake happened on 8th April, I would also like to categorize the data into pre-quake, earthquake and post-quake to look as the possible uncertainties in the data. | In order to do this, I have created another calculated field, “Event” to split the data by the day part of the datetime field so as to allow filter base on the day. Pre-quake will include data from 6th-7th April, Earthquake will include data from 8th April and Post-quake will include data from 9th April onwards. |
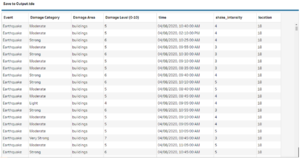
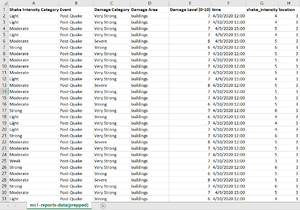
After these transformation, the final output of our mc1-reports-data.csv looks like this. I have save this under the file name, “mc1-reports-data(prepped).csv”
| Issue | Solution |
|---|---|
| Issue 4: When I tried to import the shapefile from MC2 as well as the mc1-majorquake-shapemap.png, I am unable to get the actual size of the polygon on to the map.
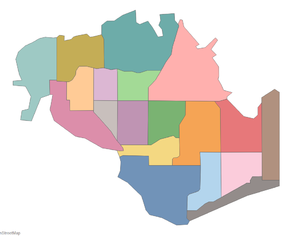
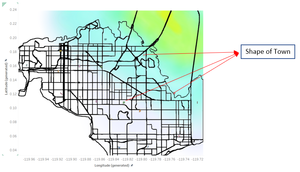
Without the mc1-majorquake-shapemap.png, I am able to get the size of the polygon to match the shape of the town as seen in the picture below. However, when I tried to include mc1-majorquake-shapemap.png, each polygon appeared very small as seen below. The size of the polygon is no longer the actual shape of the town. |
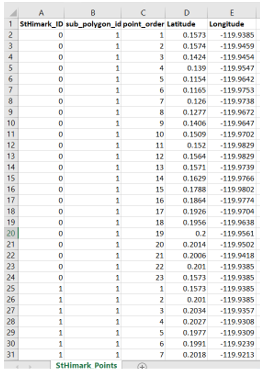
With the help of the discussion forum and reading through the threads in the discussion forum, we need to create the outline of the map of each polygon. These data points are then stored in St.Himark_Points.csv. |
Dataset Import Structure & Process
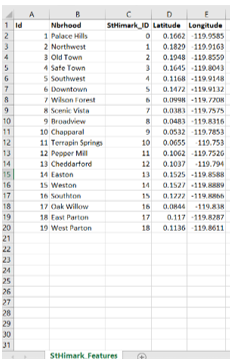
After performing the data transformation, the following files will be inputted into Tableau. A snippet of the attributes in each csv file is shown below.
1. mc1-reports-data(prepped).csv
2. StHimark_Features.csv
3. StHimark_Points.csv
Connection of Datasets
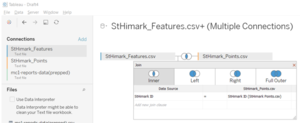
The picture below shows an overview of how I connected the datasets.
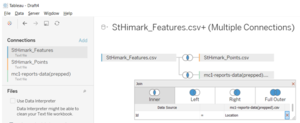
As we are importing multiple files, we need to tell Tableau how the files are related to one another. In this case, the files do have a common attribute. The connection between each file is as seen below.
StHimark_Feature.csv is connected to StHimark_Points.csv via StHimark ID.
StHimark_Feature.csv is connected to mc1-reports-data(prepped).csv via Id from StHimark_Feature and Location from mc1-reports-data(prepped).csv.
Additional Data Transformation
| Issue | Problem |
|---|---|
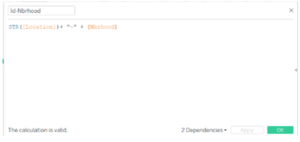
| As the current Location ID and Neighborhood is separated, it is difficult to read both of these values together. | For convenience purpose, I added a new calculation field, “Id-Nbrhood” inside Tableau which contains both the ID and neighborhood at once. |
