Difference between revisions of "IS428 AY2019-20T1 Assign Chua Xuan Ni, Rachel DASHBOARDS"
Jump to navigation
Jump to search
| (One intermediate revision by the same user not shown) | |||
| Line 5: | Line 5: | ||
<!--MAIN HEADER --> | <!--MAIN HEADER --> | ||
{|style="background-color:#376E6F ;" width="100%" cellspacing="0" cellpadding="0" valign="top" border="0" | | {|style="background-color:#376E6F ;" width="100%" cellspacing="0" cellpadding="0" valign="top" border="0" | | ||
| − | | style="font-family:Century Gothic; font-size:100%; solid #000000; background:# | + | | style="font-family:Century Gothic; font-size:100%; solid #000000; background:#76BA1B; text-align:center;" width="20%" | |
; | ; | ||
[[IS428_AY2019-20T1_Assign_Chua_Xuan_Ni,_Rachel_PROBLEM & MOTIVATION| <font color="#FFFFFF">PROBLEM & MOTIVATION</font>]] | [[IS428_AY2019-20T1_Assign_Chua_Xuan_Ni,_Rachel_PROBLEM & MOTIVATION| <font color="#FFFFFF">PROBLEM & MOTIVATION</font>]] | ||
| − | | style="font-family:Century Gothic; font-size:100%; solid #1B338F; background:# | + | | style="font-family:Century Gothic; font-size:100%; solid #1B338F; background:#76BA1B; text-align:center;" width="20%" | |
; | ; | ||
[[IS428_AY2019-20T1_Assign_Chua_Xuan_Ni,_Rachel_DATA TRANSFORMATION| <font color="#FFFFFF">DATA TRANSFORMATION</font>]] | [[IS428_AY2019-20T1_Assign_Chua_Xuan_Ni,_Rachel_DATA TRANSFORMATION| <font color="#FFFFFF">DATA TRANSFORMATION</font>]] | ||
| − | | style="font-family:Century Gothic; font-size:100%; solid #1B338F; background:# | + | | style="font-family:Century Gothic; font-size:100%; solid #1B338F; background:#76BA1B; text-align:center;" width="20%" | |
; | ; | ||
[[IS428_AY2019-20T1_Assign_Chua_Xuan_Ni,_Rachel_INTERACTIVE VISUALIZATION| <font color="#FFFFFF">INTERACTIVE VISUALIZATION</font>]] | [[IS428_AY2019-20T1_Assign_Chua_Xuan_Ni,_Rachel_INTERACTIVE VISUALIZATION| <font color="#FFFFFF">INTERACTIVE VISUALIZATION</font>]] | ||
| − | | style="font-family:Century Gothic; font-size:100%; solid #1B338F; background:# | + | | style="font-family:Century Gothic; font-size:100%; solid #1B338F; background:#76BA1B; text-align:center;" width="20%" | |
; | ; | ||
[[IS428_AY2019-20T1_Assign_Chua_Xuan_Ni,_Rachel_DASHBOARDS| <font color="#FFFFFF">DASHBOARDS</font>]] | [[IS428_AY2019-20T1_Assign_Chua_Xuan_Ni,_Rachel_DASHBOARDS| <font color="#FFFFFF">DASHBOARDS</font>]] | ||
| − | | style="font-family:Century Gothic; font-size:100%; solid #1B338F; background:# | + | | style="font-family:Century Gothic; font-size:100%; solid #1B338F; background:#76BA1B; text-align:center;" width="20%" | |
; | ; | ||
[[IS428_AY2019-20T1_Assign_Chua_Xuan_Ni,_Rachel_TASK & QUESTIONS| <font color="#FFFFFF">TASK & QUESTION</font>]] | [[IS428_AY2019-20T1_Assign_Chua_Xuan_Ni,_Rachel_TASK & QUESTIONS| <font color="#FFFFFF">TASK & QUESTION</font>]] | ||
| Line 29: | Line 29: | ||
== Dashboard Link == | == Dashboard Link == | ||
| − | The link of the visualization can be found here: https://public.tableau.com/profile/rachel.chua#!/vizhome/IS428_MiniChallenge1_rachel_chua_2017/HOME | + | The link of the visualization can be found here: https://public.tableau.com/profile/rachel.chua#!/vizhome/IS428_MiniChallenge1_rachel_chua_2017/HOME. Please view the visualization on the link, instead of using the pictures below for the clearest visualization. |
== Dashboard 1: Home Page == | == Dashboard 1: Home Page == | ||
| Line 38: | Line 38: | ||
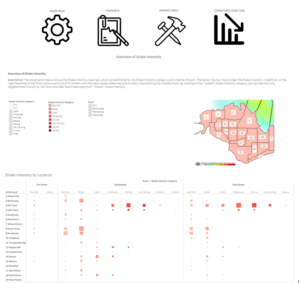
== Dashboard 3: Overview of Shake Intensity == | == Dashboard 3: Overview of Shake Intensity == | ||
| − | + | [[File:Rachel.chua.2017 Shake intensity.png|frameless|center]] | |
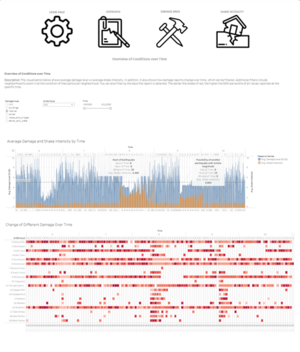
== Dashboard 4: Conditions over Time == | == Dashboard 4: Conditions over Time == | ||
| + | [[File:Rachel.chua.2017 conditions over time.png|frameless|center]] | ||
Latest revision as of 22:34, 11 October 2019
 IS428 VAST 2019 Mini Challenge 1
|
|
|
|
|
|
Contents
Dashboard Link
The link of the visualization can be found here: https://public.tableau.com/profile/rachel.chua#!/vizhome/IS428_MiniChallenge1_rachel_chua_2017/HOME. Please view the visualization on the link, instead of using the pictures below for the clearest visualization.
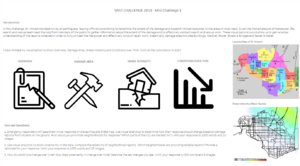
Dashboard 1: Home Page

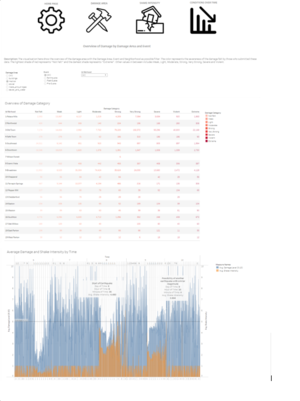
Dashboard 2: Overview of Damage Area

Dashboard 3: Overview of Shake Intensity

Dashboard 4: Conditions over Time
