Difference between revisions of "ISSS608 Assign Pu Yiran-Visualization & Dashboard Design"
Jump to navigation
Jump to search
| Line 28: | Line 28: | ||
|} | |} | ||
=<font face="Book Antigua"; size=5>'''Task 1 & Task 3'''</font>= | =<font face="Book Antigua"; size=5>'''Task 1 & Task 3'''</font>= | ||
| + | ==<font face="Book Antigua"; size=5>Calendar View</font>== | ||
| + | [[File:Viz 001.png|500px|right]] | ||
| + | <font face="Modern", size=2> | ||
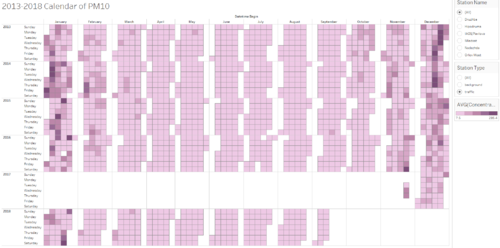
| + | In task 1, daily data from 2013-2017 is given and hourly data of 2018 is given. Calendar can give a general view of daily historical PM10 pollution level in Sofia city. | ||
| + | <br> | ||
| + | <br> | ||
| + | For task 1, two types of calendars are designed. In the static calendar, depth of colour represents daily concentration of PM10. In the interactive calendar, allowing reader to key in a value of concentration, differentiates days with excessive concentration determined by user, where red colour is the alter of overshooting PM10. | ||
| + | <br> | ||
| + | [[File:Viz 002.png|1000px]] | ||
| + | </font> | ||
| + | |||
| + | ==<font face="Book Antigua"; size=5>Interactive Monthly Average & Daily Average Time Series</font>== | ||
| + | |||
=<font face="Book Antigua"; size=5>'''Task 2 & Task 3'''</font>= | =<font face="Book Antigua"; size=5>'''Task 2 & Task 3'''</font>= | ||
Revision as of 11:46, 18 November 2018
 Unmask Air Pollution in Sofia City
|
|
Visualization & |
|
|
|
Contents
Task 1 & Task 3
Calendar View

In task 1, daily data from 2013-2017 is given and hourly data of 2018 is given. Calendar can give a general view of daily historical PM10 pollution level in Sofia city.
For task 1, two types of calendars are designed. In the static calendar, depth of colour represents daily concentration of PM10. In the interactive calendar, allowing reader to key in a value of concentration, differentiates days with excessive concentration determined by user, where red colour is the alter of overshooting PM10.
