ISSS608 2018-19 T1 Assign Pu Yiran
|
Background & |
|
|
|
|
Contents
What's Happening in Bulgaria
Air pollution is an important risk factor of health in Europe and worldwide, as there is convincing evidence that the primary air pollutant PM10 and PM2.5, regardless of source, have detrimental health effects. The most important anthropogenic sources of PM in ambient air in Europe are exhaust and non-exhaust emissions from road traffic and combustion of solid biomass.
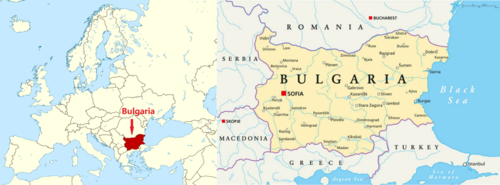
Bulgaria, among European countries, is said to have the dirtiest air, with PM10 and PM2.5 overshooting EU limit. Urban populations in Bulgaria are exposed to the increasing risk of heart disease, lung cancer, respiratory diseases and stroke.
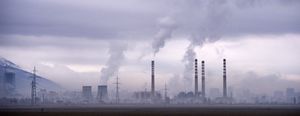
Bulgaria’s main sources of PM10, and fine particle pollution PM2.5 (particles 2.5 microns or smaller) are household burning of fossil fuels or biomass, and transport. Production of electricity by burning of coal in thermal power plants and other industrial processes are a major contributor to unhealthy air.
What are PM10 and PM2.5
PM (particulate matter) is a mixture of solids and liquid droplets floating in the air.PM10(Coarse dust particles) is particle matter 2.5-10μm in diameter and PM2.5(Fine particles) is particle matter 2.5 μm or less in diameter.
Sources of PM10 include crushing or grinding operations and dust stirred up by vehicles on roads. PM2.5 are produced from all types of combustion, including motor vehicles, power plants, residential wood burning, forest fires, agricultural burning, and some industrial processes.
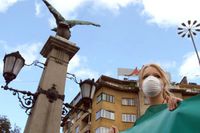
Usually PM10 can be seen especially when the concentration is high, while PM2.5 is invisible to naked eyes but only visible under with an electron microscope, thus, urban population may not be conscious that they are exposed in PM2.5 pollutant. Normal mask can’t protect people from micro-particles such as PM2.5, thus, as air pollution level increases worldwide, N95, N99 and P95 air masks have came out to protect people from micro-particles.
The Task
Task 1: Spatio-temporal Analysis of Official Air Quality
Characterize the past and most recent situation with respect to air quality measures in Sofia City. What does a typical day look like for Sofia city? Do you see any trends of possible interest in this investigation? What anomalies do you find in the official air quality dataset? How do these affect your analysis of potential problems to the environment?
Task 2: Spatio-temporal Analysis of Citizen Science Air Quality Measurements
Using appropriate data visualisation, you are required will be asked to answer the following types of questions:
- Characterize the sensors’ coverage, performance and operation. Are they well distributed over the entire city? Are they all working properly at all times? Can you detect any unexpected behaviors of the sensors through analyzing the readings they capture? Limit your response to no more than 4 images and 600 words.
- Now turn your attention to the air pollution measurements themselves. Which part of the city shows relatively higher readings than others? Are these differences time dependent? Limit your response to no more than 6 images and 800 words.
Task 3
Urban air pollution is a complex issue. There are many factors affecting the air quality of a city. Some of the possible causes are:
- Local energy sources. For example, according to Unmask My City, a global initiative by doctors, nurses, public health practitioners, and allied health professionals dedicated to improving air quality and reducing emissions in our cities, Bulgaria’s main sources of PM10, and fine particle pollution PM2.5 (particles 2.5 microns or smaller) are household burning of fossil fuels or biomass, and transport.
- Local meteorology such as temperature, pressure, rainfall, humidity, wind etc
- Local topography
- Complex interactions between local topography and meteorological characteristics.
- Transboundary pollution for example the haze that intruded into Singapore from our neighbours.
In this third task, you are required to reveal the relationships between the factors mentioned above and the air quality measure detected in Task 1 and Task 2. Limit your response to no more than 5 images and 600 words.
Datasets
Datasets Overview
Official Air Quality Datasets (EEA)
In urban area of Sofia city, there are 6 air quality monitoring stations, named as Nadezhda (BG0040A), Hipodruma (BG0050A), Druzhba (BG0052A), Orlov Most (BG0054A), IAOS/Pavlovo (BG0073A) and Mladost(BG0079A), monitoring concentration of air pollutant PM10.
The dataset consists of concentration of PM10 measured daily/hourly in 6 years (2013-2018), by 6 stations. Additional information about each monitoring station, such as geo-location is also provided.

Citizen Science Air Quality Data (AirTube)
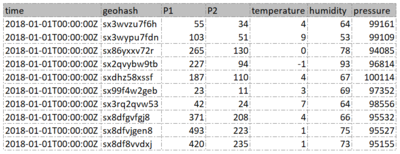
In this dataset, concentration of pollutant PM10 and PM2.5, humidity, pressure and temperature have been measured hourly from 538 sensors located across Bulgaria in 2017 and 2018. Geo-location is encoded in geohash format.
PM10 and PM2.5 are named as P1 and P2 in given data.
Meteorological Measurements and Topographic Data
- Meteorological measurements have been monitored daily at Sofia Airport (longitude= 42.6537, latitude= 23.3829 and altitude= 595 metres) from 2012 to 2018. Meteorological measurements include temperature, humidity, wind speed, surface pressure, precipitation volume and visibility.
- Longitude, latitude and elevation of 196 geo-point in Sofia capital city are given in topographic data.
Datasets Preparation
EEA Dataset-Discover and fix inconsistent time interval of measurement
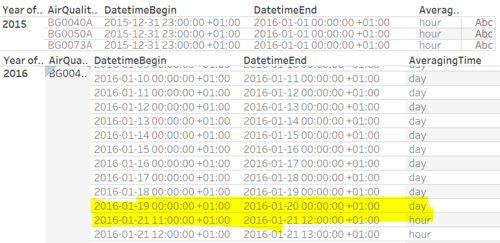
For year 2013 and 2014, concentration of PM10 is given as daily average. However, in 2015,2016 and 2017, data of certain days is given in hourly average. In 2018, data is all given in hourly average.
To analyse the past the most recent patterns of PM10 in Sofia city, data of 2013-2017 has been aggregated to daily average and merged in R. Data of 2018 remained hourly average.

EEA Dataset-Group 24 hours into 4 time periods
As hourly data of 2018 is given, we will be able to find out how air quality is changing during one day, to make which more realistic, 24 hours of a day are split into 4 time periods—before dawn, morning, afternoon and evening, by using below formula.

Airtube Dataset-Decode geohash into Long-Lat format
Since Tableau is not able to identify geohash format, we need to decode geohash into corresponding longitude and latitude in R. The package used for decoding geohash is ‘geohash’.

Acknowledgement
Creator:
PU Yiran
yiran.pu.2017@mitb.smu.edu.sg
Instructor:
Professor KAM Tin Seong
