ISSS608 Assign Pu Yiran-Task 3
|
|
|
|
|
Task 3 & |
Meteorological Factors in Sofia City
The meteorological measurements were captured daily by Sofia airport, including humidity, tempreture, pressure, precipitation and wind speed. Combined with EEA data, we are able to discover some relationships between meteographical factors and PM10 levels.
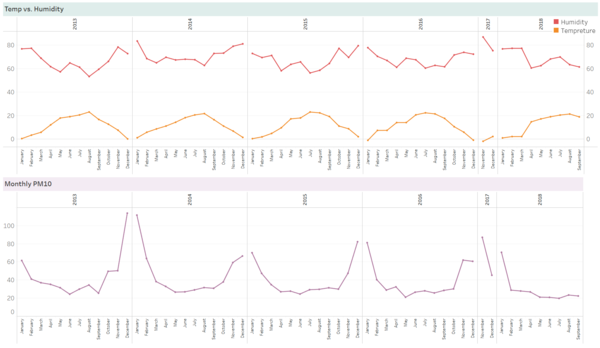
Based on insights from previous sections, winters has the highest PM10, which can be proved from below visualization.
Apparently, in Sofia, during one year, tempreture tends to start dropping from August, when PM10 level tends to start increasing. In December and January, which are the coldest two months, Sofia is also suffered from heavy PM10.
Humidity is also highly related tempreture and PM10. In coldest months, daily relative humidity is highest during the year, where as in warmer months, humidity level is relatively lower.
As a result, high PM10 level could be the effect of low tempreture and high humidity when the burning of fossil fuel tend to increases and the meteographical condition keeps micro-particles floating in the air.
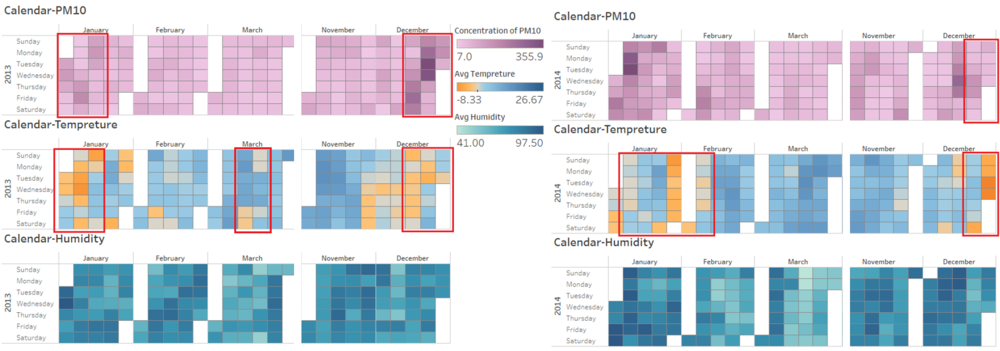
However, from below calendar view, it also can be found that, low temperature doesn’t always lead to high PM10. As highlighted in below, certain days had extremely low temperature whereas PM10 was not the highest. Thus, PM10 is not all triggered by low temperature, but there could be multiple meteorological factors.

Topographical Factors in Sofia City
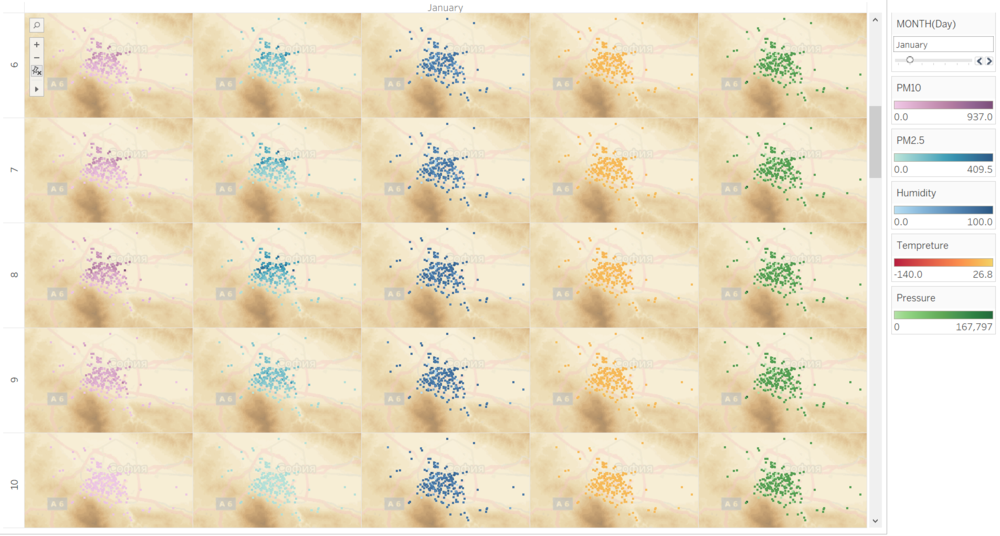
From the given topography data as well as topographical map from Tableau map service, we can see that central Sofia city is basically a flat land. Only at south western regions, there are mountains with high latitude. The 6 air quality stations in Task 1 and all the sensors in Sofia city are mostly located at flat areas, near central Sofia. Therefore, in given datasets, topographical characteristics may not have many impacts on air pollution levels in Sofia city.

Below trellis map attempts to discover interaction of meteorology and potography, but in given data, all the meteorological measurements show very even distribution across different regions in Sofia city. Very likely, this is because most of the sensors are located in central Sofia.

Conclusion
According to analysis in 3 tasks, below conclusions can be drawn:
1) In winter—November, December, January and February, Sofia is suffered from heavy air pollutions and urban populations are exposed in high risk of air pollution related health issues.
2) In winter, nearly half number of days had daily concentration of PM10 and PM2.5 overshooting EU limit as well as WHO limit. In the rest months, although pollution level is much lower, certain days still had excessive PM.
3) Within the city, north central regions is the most polluted regions, followed by the central region, where the health impact of PM2.5 went critical to ‘Unhealthy’ and ‘Very unhealthy’. South central and south region have relatively less pollutions and better air quality.
4) In urban area, traffic dominated areas tend to have higher pollution level than general living areas at most of the time.
5) Within one day, the most polluted time period is 8pm—12am and 12am—5am.
6) Bulgaria has distinct seasons, with hot summer and cold winter. In winter, low temperature is usually accompanied by high relative humidity, which could form the atmospheric environment that maintain micro-particles floating in the air.
7) In given data, due to the coverage of sensor in Sofia city, and due to the discontinuous work of sensors, we couldn’t discover clear patterns and relationships between photography and air pollution.
8) In the past 6 years—from 2013 to 2018, air pollution in Sofia city has reduced significantly, which is a good news, but there is still a long way to go.

