ISSS608 2017-18 T3 Assign FU CHUANJIE Visualization
|
|
|
|
|
Question 1
Characterize the past and most recent situation with respect to chemical contamination in the Boonsong Lekagul waterways. Do you see any trends of possible interest in this investigation?
Increasing trend in arsenic levels
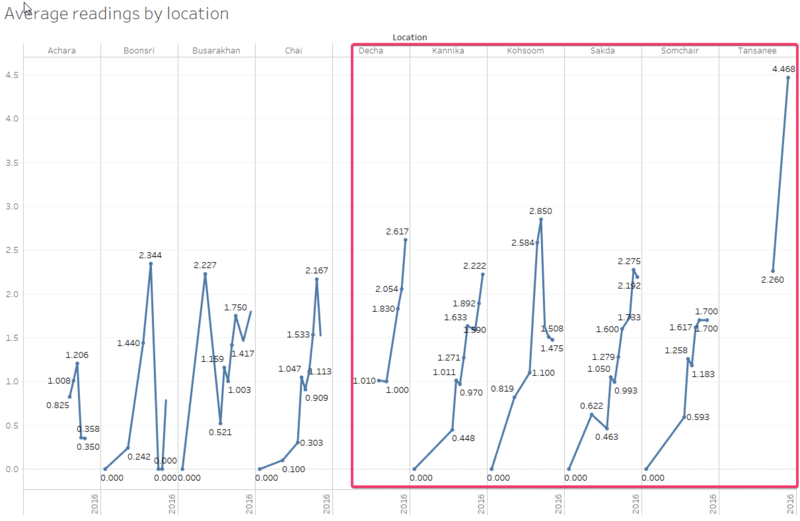
Arsenic levels in the waterways have been below 10 µg/l (i.e. the safe limits prescribed by United States Environmental Protection Agency). However, there has been increasing trend in arsenic levels for a few areas. Tansanee has seen its arsenic levels increase from 2.26 µg/l (2011) to 4.468 µg/l (2015). If this trend continues, the arsenic levels might cause the waters not to be safe for consumption.
Sodium level 10 times above acceptable limits
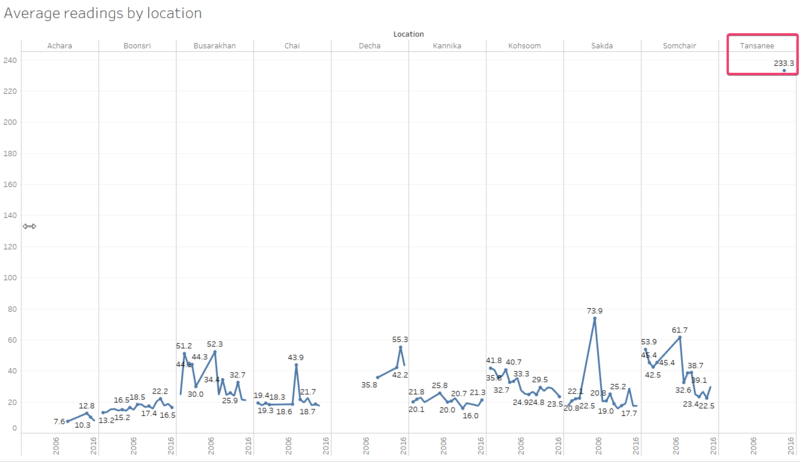
Based on the drinking water advisory from United States Environmental Protection Agency (“EPA”), the recommended sodium levels in drinking water should not exceed 20 mg/l. However, from water sensors at Tansanee, the sodium level is 233.3 mg/l for 2016. This is 10 times the acceptable level recommended by EPA. There is only one water sensor available for that creek and not many records exist. Hence, it is possible that the sodium level has always been that high.
Question 2a
What anomalies do you find in the waterway samples dataset?
The anomalies noted in the waterway samples dataset are as follows:
- Waterway readings are sparse
- Interval between readings extend from 2007 to 2016 (i.e. especially Boonsri)
- Minimal waterway sensors for certain waterways
Sparse waterway readings
From observations, the water sensor readings have been taken sporadically. For example, the sodium level readings are only available in Tansanee for 2016. This makes it difficult to assess the waterway’s health.

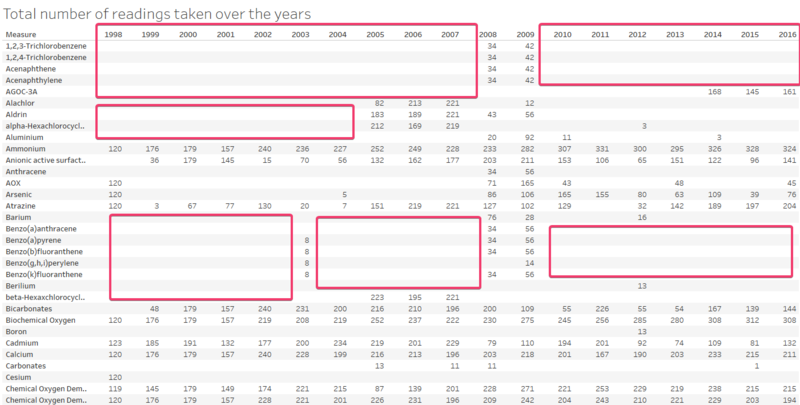
As highlighted in the box in red, there is a lack of information on certain measures. This can be observed with the lack of records from the table below (i.e. as highlighted by the red boxes).
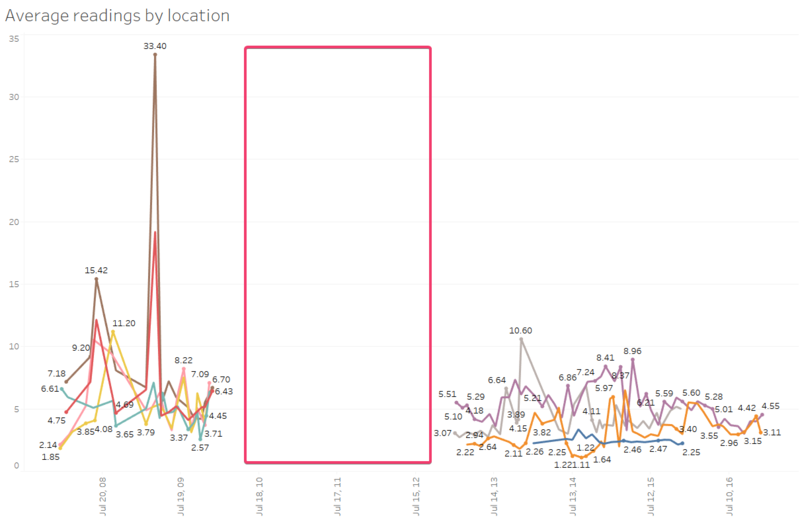
The chart below on the total organic carbon measure shows that the data collection process has not been disciplined with 4 years missing data records.
Interval between readings
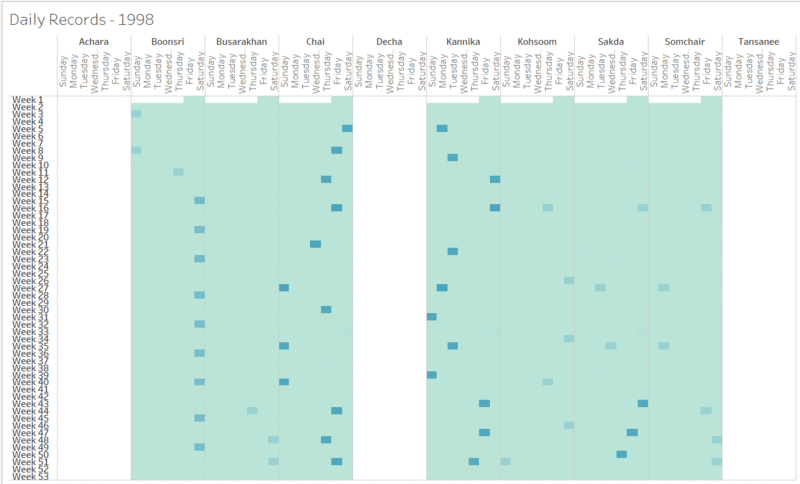
The dataset suggests that water sensor readings were collected less regularly. For the Boonsri waterway sensor, readings were taken every 2 weeks in 2007. However, the interval between readings became 4 weeks thereafter. This can be seen from the GIF animation below. To see the animation, please click the image until a full screen image is shown.
Minimal waterway sensors for certain waterways
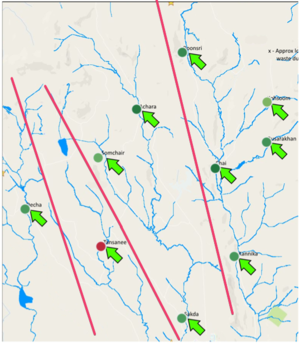
The waterways on the map can be divided into 4 waterways (i.e. as demarcated by the line in red). The rightmost waterway has five waterway sensors. However, the first two waterways on the left have only 1 waterway sensor. The third waterway has 3 waterway sensors. With minimal data from some of the waterways, a fair assessment might not be formed for those waterways.
