ISSS608 2017-18 T3 Assign FU CHUANJIE Visualization
|
|
|
|
|
Question 1
Characterize the past and most recent situation with respect to chemical contamination in the Boonsong Lekagul waterways. Do you see any trends of possible interest in this investigation?
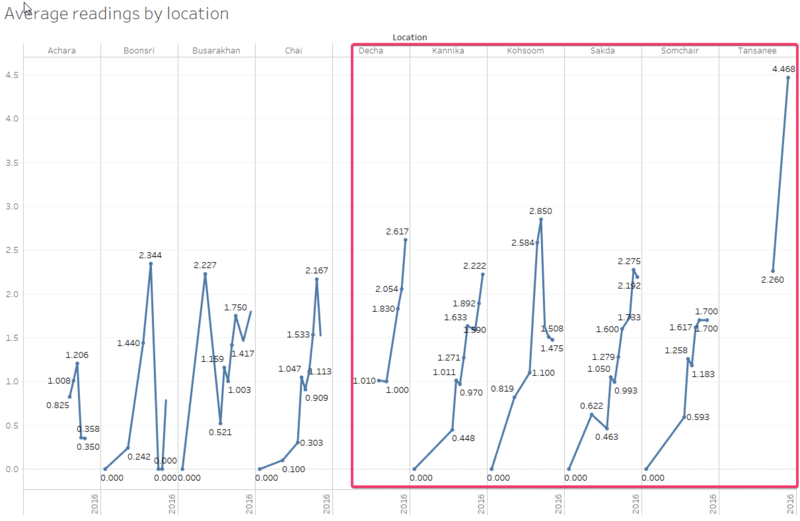
Increasing trend in arsenic levels
Arsenic levels in the waterways have been below 10 µg/l (i.e. the safe limits prescribed by United States Environmental Protection Agency). However, there has been increasing trend in arsenic levels for a few areas. Tansanee has seen its arsenic levels increase from 2.26 µg/l (2011) to 4.468 µg/l (2015). If this trend continues, the arsenic levels might cause the waters not to be safe for consumption.
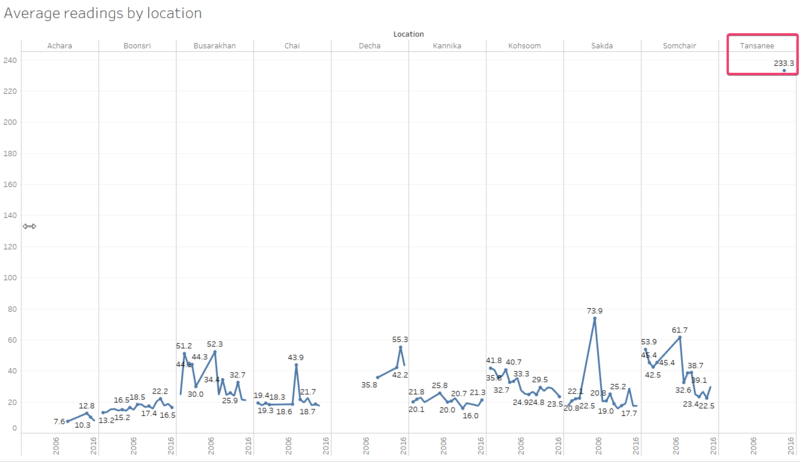
Sodium level 10 times above acceptable limits
Based on the drinking water advisory from United States Environmental Protection Agency (“EPA”), the recommended sodium levels in drinking water should not exceed 20 mg/l. However, from water sensors at Tansanee, the sodium level is 233.3 mg/l for 2016. This is 10 times the acceptable level recommended by EPA. There is only one water sensor available for that creek and not many records exist. Hence, it is possible that the sodium level has always been that high.
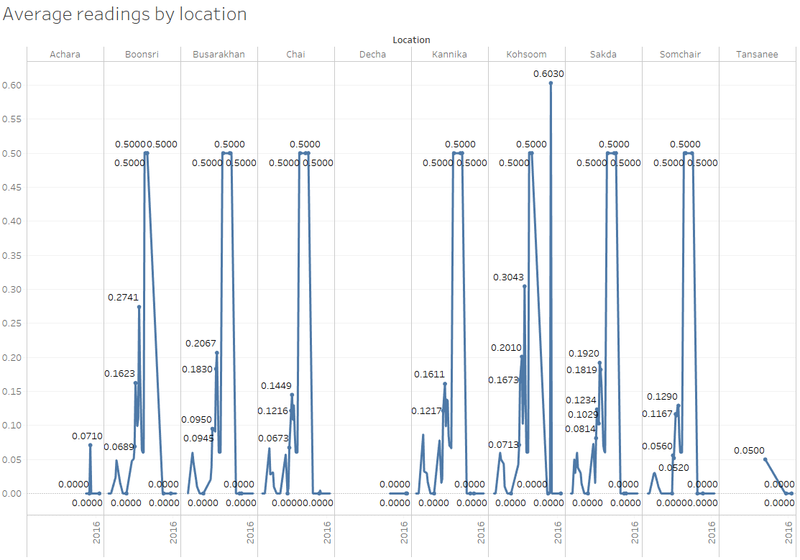
Atrazine levels are have consistently spiked
The atrazine levels have consistently spiked across all the locations where readings are available for 4Q 2010. This pattern seen across all the locations should be investigated further for the root cause.
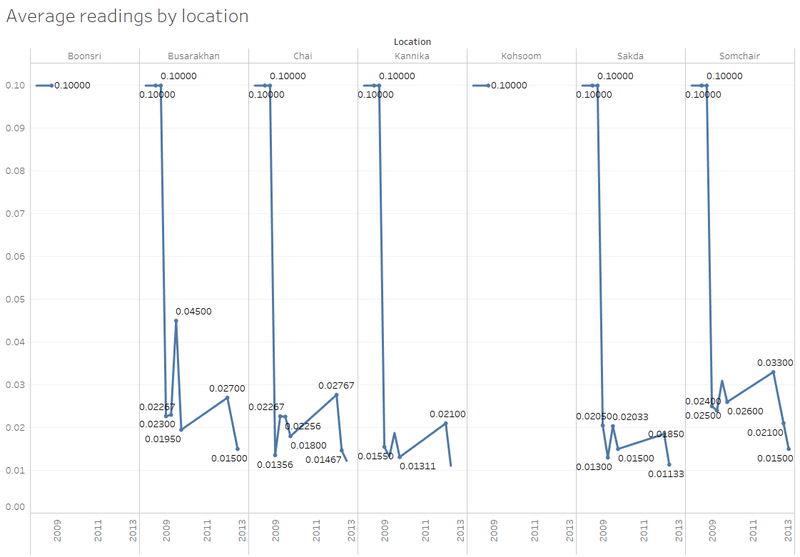
Sulfide levels have declined substantially from pre-2008
Sulfide levels for 2008 and before are flat at 0.10 mg/l for all locations with available readings. This observation should be investigated fully given the round number observed and the consistent timings of these observations.
Consistent patterns for petroleum hydrocarbons
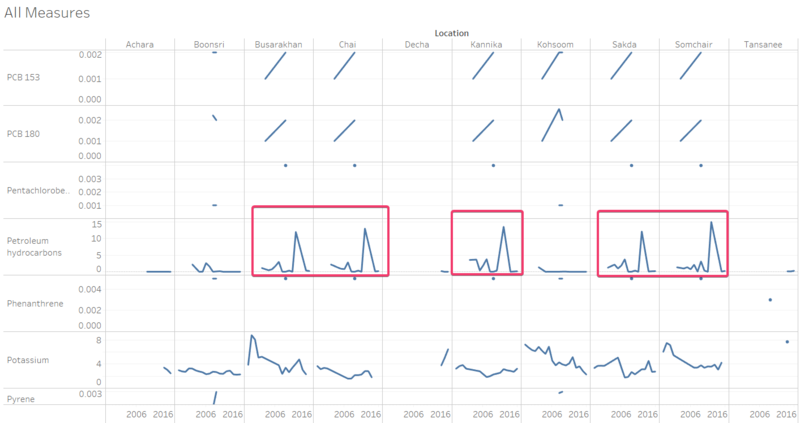
For Busarakhan, Chai, Kannika, Sakda and Somchair, it was noted that the average yearly readings for petroleum hydrocarbons followed the same pattern. Further investigation is warranted to under why the patterns in the readings have been consistent, as highlighted by the lines boxed up in red.
Question 2a
What anomalies do you find in the waterway samples dataset?
The anomalies noted in the waterway samples dataset are as follows:
- Waterway readings are sparse
- Interval between readings extend from 2007 to 2016 (i.e. especially Boonsri)
- Minimal waterway sensors for certain waterways
- Haphazard sampling methodology
Sparse waterway readings
From observations, the water sensor readings have been taken sporadically. For example, the sodium level readings are only available in Tansanee for 2016. This makes it difficult to assess the waterway’s health.

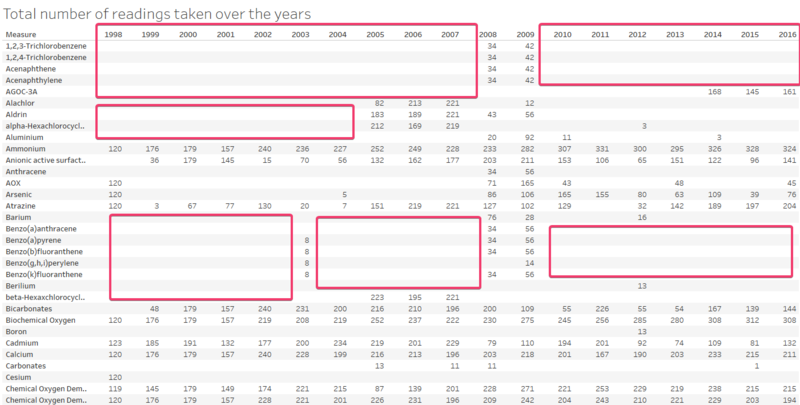
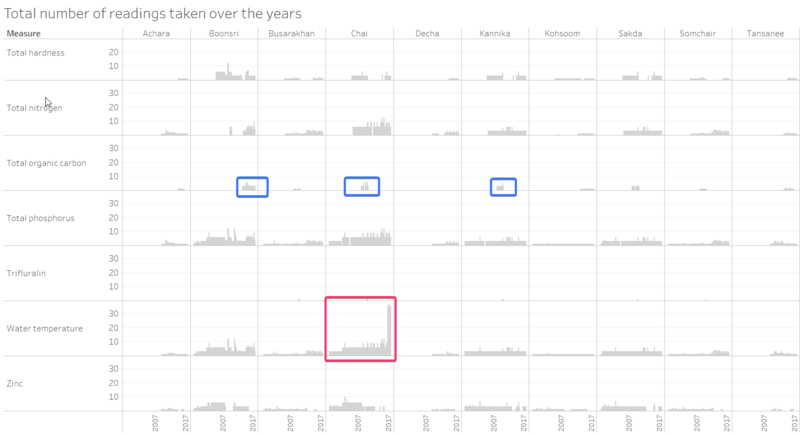
As highlighted in the box in red, there is a lack of information on certain measures. This can be observed with the lack of records from the table below (i.e. as highlighted by the red boxes).
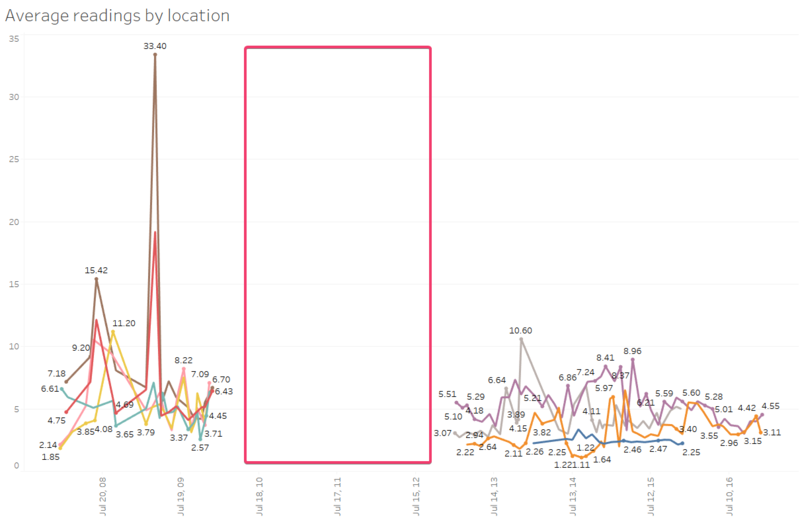
The chart below on the total organic carbon measure shows that the data collection process has not been disciplined with 4 years missing data records.
Interval between readings
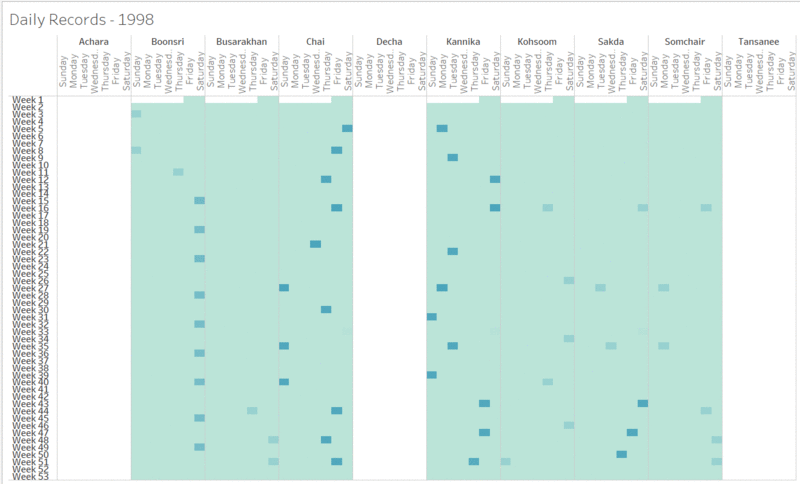
The dataset suggests that water sensor readings were collected less regularly. For the Boonsri waterway sensor, readings were taken every 2 weeks in 2007. However, the interval between readings became 4 weeks thereafter. This can be seen from the GIF animation below. To see the animation, please click the image until a full screen image is shown.
Minimal waterway sensors for certain waterways
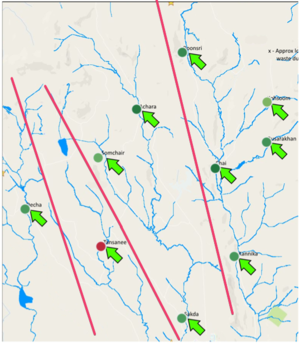
The waterways on the map can be divided into 4 waterways (i.e. as demarcated by the line in red). The rightmost waterway has five waterway sensors. However, the first two waterways on the left have only 1 waterway sensor. The third waterway has 3 waterway sensors. With minimal data from some of the waterways, a fair assessment might not be formed for those waterways.
Haphazard sampling methodology
The hydrology data has been collected haphazardly. The number of water temperature readings collected near the end of 2016 has been very voluminous in Chai as seen from the spike in the bar chart boxed up in red. However, the temperature readings for the other locations have been more regular.
Total organic carbon readings across the locations have been collected at different times across the different locations. This makes it difficult to compare the readings by location as the time periods are different. This observation has been boxed up in blue in the image below.
Question 2b
How do these affect your analysis of potential problems to the environment?
Four anomalies were mentioned in the response to the question before:
- Waterway readings are sparse
- Interval between readings extend from 2007 to 2016 (i.e. especially Boonsri)
- Minimal waterway sensors for certain waterways
- Haphazard sampling methodology
[1] With sparse waterway readings, it is difficult to study the trends of the various chemicals in the waterway. Hence, the past and current trends in the chemical measurements would not be meaningful.
[2] With differing frequencies in the waterway readings, it would be difficult to utilize the data to understand the volatility of the chemical measurements. This is because volatility of the measures would not be reflected in the data due to the extended length of time between recordings.
[3] With only one waterway sensor in each of the left two waterways, there is a possibility that any analysis of the waterway’s health would be misleading. This is because the upstream and downstream waterway’s health is unknown.
[4] As mentioned in the previous section, there does not seem to be any proper routine in place to decide what sort of measures to be collected at each time. All the data points collected seem to be done on an impromptu basis.
Question 2c
Is the Hydrology Department collecting sufficient data to understand the comprehensive situation across the Preserve?
As highlighted in anomaly [3], there is minimal waterway sensors for the left two waterways. This would present problems in establishing the waterway’s health for those two waterways. In addition, as per anomaly [1], measures are not available for all the measures across many of the periods. Some measures are only intermittently available. All these anomalies reflects that insufficient data has been collected.
Question 2d
What changes would you propose to make in the sampling approach to best understand the situation?
- More regular readings need to be obtained for the different waterways
- More waterway sensors need to be installed for the left two waterways
Question 3a
After reviewing the data, do any of your findings cause particular concern for the Pipit or other wildlife?
Spike in Methylosmoline near dump site
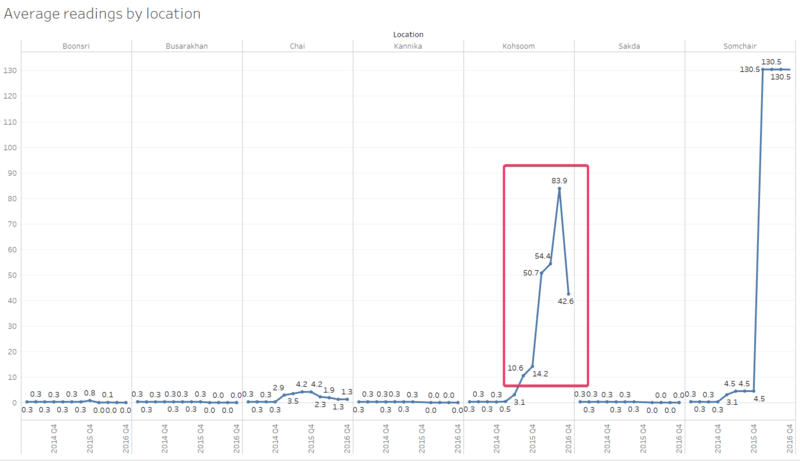
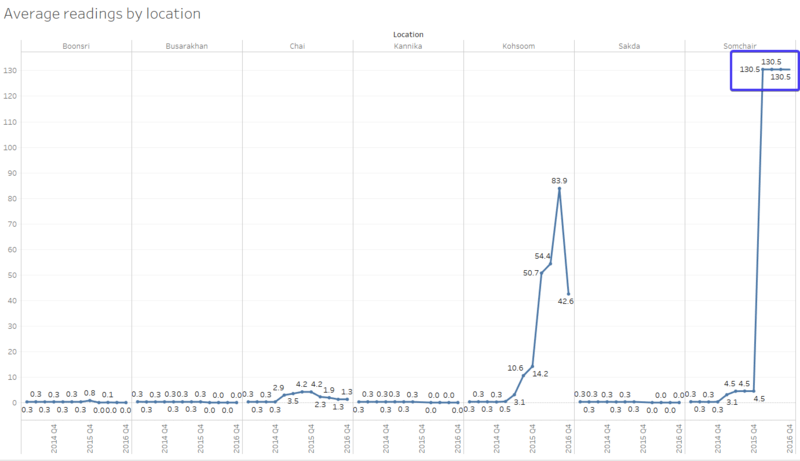
There have been concerns that a toxic chemical, Methylosmoline, has been dumped near Kohsoom. This has not been detected through soil analysis as new top soil has been trucked in to cover the existing ground. However, through hydrology data, Kohsoom showed a large increase in Methylosmoline content that increased from 3.1 µg/l [2Q 2015] to 83.9 µg/l [3Q 2016] (i.e. as indicated in the box in red).
Methylosmoline does not flow downstream
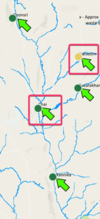
Even though Kohsoom’s average reading of Mehylosmoline for the second half of 2016 is 63.2 µg/l, the reading of the same at Chai, which is just downstream is only 1.3 µg/l. This seems to suggest that the chemical is easily diluted in water and does not contaminate water downstream.
29-fold increase in Methylosmoline reading
One observation that could be worth investigating is the spike in the Methylosmoline at Somchair (i.e. as indicated in the box in blue). The readings for the entire 2016 was at 130.5 µg/l which is a 29-fold increase from Q4 2015 at 4.5 µg/l.
Question 3b
Would you suggest any changes in the sampling strategy to better understand the waterways situation in the Preserve?
- More regular readings need to be obtained for the different waterways
- More waterway sensors need to be installed for the left two waterways
