Difference between revisions of "ISSS608 2017-18 T3 Assign Fu Chuanjie"
| (10 intermediate revisions by the same user not shown) | |||
| Line 1: | Line 1: | ||
<div style=background:#ABB7D0 border:#A3BFB1> | <div style=background:#ABB7D0 border:#A3BFB1> | ||
| − | [[Image: | + | [[Image:Ind-Logo.png|165px]] |
<b><font size = 6; color="#42485D"> VAST Challenge 2018: Like a Duck to Water</font></b> | <b><font size = 6; color="#42485D"> VAST Challenge 2018: Like a Duck to Water</font></b> | ||
</div> | </div> | ||
| Line 7: | Line 7: | ||
| style="font-family:Century Gothic; font-size:100%; solid #000000; background:#ABB7D0; text-align:center;" width="25%" | | | style="font-family:Century Gothic; font-size:100%; solid #000000; background:#ABB7D0; text-align:center;" width="25%" | | ||
; | ; | ||
| − | [[ISSS608_2017- | + | [[ISSS608_2017-18_T3_Assign_Fu_Chuanjie|<b><font size="4"><font color="#93e0a8">Background</font></font></b>]] |
| style="font-family:Century Gothic; font-size:100%; solid #1B338F; background:#ABB7D0; text-align:center;" width="25%" | | | style="font-family:Century Gothic; font-size:100%; solid #1B338F; background:#ABB7D0; text-align:center;" width="25%" | | ||
; | ; | ||
| − | [[ISSS608_2017-18_T3_Assign_FU_CHUANJIE_Data_Preparation|<b><font size=" | + | [[ISSS608_2017-18_T3_Assign_FU_CHUANJIE_Data_Preparation|<b><font size="4"><font color="#42485D">Methodology & Dashboard Design</font></font></b>]] |
| style="font-family:Century Gothic; font-size:100%; solid #1B338F; background:#ABB7D0; text-align:center;" width="25%" | | | style="font-family:Century Gothic; font-size:100%; solid #1B338F; background:#ABB7D0; text-align:center;" width="25%" | | ||
; | ; | ||
| − | [[ISSS608_2017-18_T3_Assign_FU_CHUANJIE_Visualization|<b><font size=" | + | [[ISSS608_2017-18_T3_Assign_FU_CHUANJIE_Visualization|<b><font size="4"><font color="#42485D">Insights</font></font></b>]] |
| style="font-family:Century Gothic; font-size:100%; solid #1B338F; background:#ABB7D0; text-align:center;" width="25%" | | | style="font-family:Century Gothic; font-size:100%; solid #1B338F; background:#ABB7D0; text-align:center;" width="25%" | | ||
; | ; | ||
| − | [[ISSS608_2017-18_T3_Assign_FU_CHUANJIE_Conclusion| <b><font size=" | + | [[ISSS608_2017-18_T3_Assign_FU_CHUANJIE_Conclusion| <b><font size="4"><font color="#42485D">Conclusion</font></font></b>]] |
| | | | ||
| Line 25: | Line 25: | ||
<br/> | <br/> | ||
| − | <font size="5"><font color="# | + | <font size="5"><font color="#42485D">'''Uncovering evidence with water studies'''</font></font> |
| − | + | Kasios’ spokespersons have denied any accusation of industrial waste dumping. They have emphasized that there is no ground contamination near the remote ranger station as suggested by last year’s challenge. Ornithologists from Mistford College have tried to take soil samples from the site to prove the existence of ground contamination. However, they have found that new top soil has been used to cover the site rendering any soil sampling approach useless. Without soil sampling, these ornithologists have instead turned to water sensor readings in the hope of proving contamination.<br/><br/> | |
| + | |||
| + | ---- | ||
| + | <font size="5"><font color="#42485D">'''What data is available?'''</font></font> | ||
| + | |||
| + | To assess the waterway’s health, water sensor readings have been taken across 10 separate locations in 4 different waterways. The hydrology data available is from 1998 to 2016. Within the hydrology data collected, the records include items such as hardness, water temperature, Endrin, etc. However, the level of data availability is different depending on location, measure and year.<br/><br/> | ||
| + | [[Image:Q0-001.png|800px]] | ||
| + | |||
| + | ---- | ||
| + | <font size="5"><font color="#42485D">'''How do I access the dashboard?'''</font></font><br/> | ||
| + | Click on the following link to access: [https://public.tableau.com/views/FuChuanjie-IndividualAssignment/DB-Creek?:embed=y&:display_count=yes Fu Chuanjie's Tableau Workbook] | ||
Latest revision as of 19:55, 7 July 2018
|
|
|
|
|
Uncovering evidence with water studies
Kasios’ spokespersons have denied any accusation of industrial waste dumping. They have emphasized that there is no ground contamination near the remote ranger station as suggested by last year’s challenge. Ornithologists from Mistford College have tried to take soil samples from the site to prove the existence of ground contamination. However, they have found that new top soil has been used to cover the site rendering any soil sampling approach useless. Without soil sampling, these ornithologists have instead turned to water sensor readings in the hope of proving contamination.
What data is available?
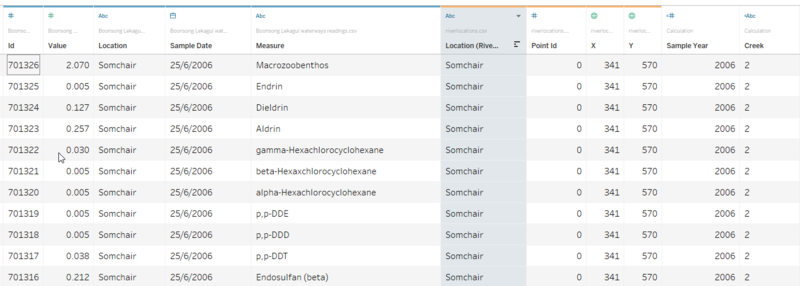
To assess the waterway’s health, water sensor readings have been taken across 10 separate locations in 4 different waterways. The hydrology data available is from 1998 to 2016. Within the hydrology data collected, the records include items such as hardness, water temperature, Endrin, etc. However, the level of data availability is different depending on location, measure and year.

How do I access the dashboard?
Click on the following link to access: Fu Chuanjie's Tableau Workbook
