IS428 2017-18 T1 Assign Wu Jianhua
Contents
Tableau Link
https://public.tableau.com/profile/jianhua2217#!/vizhome/VA_Assignment_0/Story1?publish=yes
Problem & Motivation
The four factories in the industrial area are subjected to higher-than-usual environmental assessment, due to their proximity to both the city and the preserve. Gaseous effluent data from several sampling stations has been collected over several months, along with meteorological data (wind speed and direction), that could help Mitch understand what impact these factories may be having on the Rose-Crested Blue Pipit. These factories are supposed to be quite compliant with recent years’ environmental regulations, but Mitch has his doubts that the actual data has been closely reviewed. Could visual analytics help him understand the real situation?
The primary job for Mitch is to determine which (if any) of the factories may be contributing to the problems of the Rose-crested Blue Pipit. Often, air sampling analysis deals with a single chemical being emitted by a single factory. In this case, though, there are four factories, potentially each emitting four chemicals, being monitored by nine different sensors. Further, some chemicals being emitted are more hazardous than others. Your task, as supported by visual analytics that you apply, is to detangle the data to help Mitch determine where problems may be.
Use visual analytics to analyze the available data and develop responses to the questions below
- Characterize the sensors’ performance and operation. Are they all working properly at all times? Can you detect any unexpected behaviours of the sensors through analyzing the readings they capture?
- Now turn your attention to the chemicals themselves. Which chemicals are being detected by the sensor group? What patterns of chemical releases do you see, as being reported in the data?
- Which factories are responsible for which chemical releases? Carefully describe how you determined this using all the data you have available. For the factories you identified, describe any observed patterns of operation revealed in the data.
Background Information
The four manufacturing factories south of the nature preserve which Mitch is suspicious of the chemical releases and these are their coordinates:
Roadrunner Fitness Electronics (89,27) – Roadrunner produces personal fitness trackers, heart rate monitors, headlamps, GPS watches, and other sport-related consumer electronics.
Kasios Office Furniture (90,21) – Kasios Office Furniture manufactures metal and composite-wood office furniture including desks, tables, and chairs.
Radiance ColourTek (109,26) – Radiance produces solvent based optically variable metallic flake paints.
Indigo Sol Boards (120,22) – Indigo Sol produces skateboards and snowboards.
These sensors collect information on several substances of potential concern, the chemicals are order by their harmfulness level to the human and environment:
- Methylosmolene – This is a trade name for a family of volatile organic solvents. After the publication of several studies documenting the toxic side effects of Methylosmolene in vertebrates, the chemical was strictly regulated in the manufacturing sector.
- Chlorodinine – Corrosives are materials that can attack and chemically destroy exposed body tissues. They might be hazardous in other ways too, depending on the particular corrosive material. An example is the chemical Chlorodinine. It has been used as a disinfectant and sterilizing agent as well as other uses. It is harmful if inhaled or swallowed.
- Appluimonia – An airborne odor is caused by a substance in the air that you can smell. However, odors may affect your quality of life and sense of well-being. Several odor-producing substances, including Appluimonia, are monitored under this program.
- AGOC-3A – New environmental regulations, and consumer demand, have led to the development of low-VOC and zero-VOC solvents. Most manufacturers now use one or more low-VOC substances and Mistford’s plants have wholeheartedly signed on. These new solvents, including AGOC-3A, are less harmful to human and environmental health.
Dataset Analysis & Transformation Process
The data available consists of sensor readings from a set of air-sampling sensors and meteorological data from a weather station in proximity to the factories and sensors. Each of the dataset provided has its own unique ways to process and make sense of the data to bring value to the analysis. This section will elaborate on the dataset analysis and transformation process for each dataset to prepare the data for import and analysis on an interactive visualization.
Location Data
The factories and sensors locations are provided in terms of X, Y coordinates on a 200x200 grid, with (0,0) at the lower left-hand corner (southwest). The sensors map shows the locations of the sensors and factories by number for the sensors and by name for the factories.
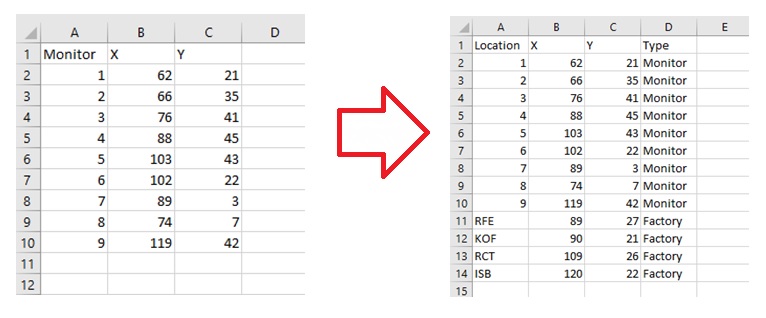
In the given dataset (Sensor Location.xlsx), the data only consist of the location details for the 9 sensors. It’s is missing the data for the factor location.
Transformation :
Include the X and Y coordination of the factory into their respective column and he coordination of the factory can be found in given “MC2 Data Descriptions” document. We add in the location of RFE, KOF, RCT and ISB which represent Roadrunner Fitness Electronics, Kasios Office Furniture, Radiance ColourTek and Indigo Sol Boards respectively. The column name from ‘Monitor’ to ‘Location’ to better reflect the details of the column after factory was added. To provide more information of table, a new column ‘Type’ was added to reflect whether the location was of Monitor or Factory.
Meteorological Data
The meteorological data provide the information of the wind details such as its direction and speed in the region. The given dataset (Meteorological Data.xlsx) provide 3 months reading in the following format:
- Date: The date and time of the readings, local time with no change for Daylight Savings.
- Wind Direction: The compass directions where the wind is originating from, using a north-referenced azimuth bearing where 360/000 is true north.
- Wind Speed: The speed of the wind in meters per second.
Transformation :
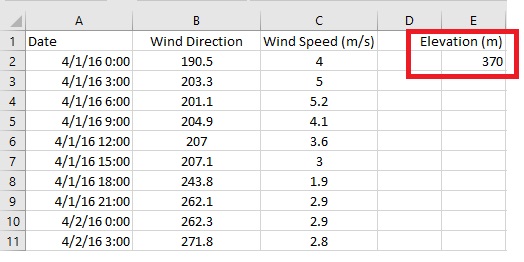
- Elevation Details:
In the dataset, it includes the elevation details which represent the height in which the wind direction and speed was measure. Such detail is not needed in our analysis, we can remove to exclude the elevation data.
- Missing Value:
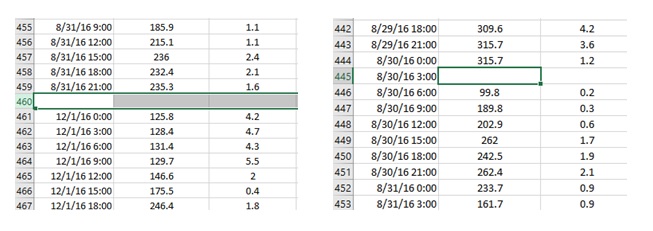
At row 460, there’s an empty row of the dataset. In the excel, we remove the entire row from the dataset
At row 445, there missing value for Wind Direction and Wind Speed Data. To fill up the empty data, we compute the average value of that date (30/8/2016) window direction and wind speed using the following formula:
Wind Direction - AVERAGE (B444, B446:B451) = 225.0
Wind Speed – AVERAGE (C444, C446:C451) = 1.1
Sensor Data
The sensor data provide the information of the reading for the different chemical at difference sensor on the date and time. The interval duration of each sensor reading is 1hr apart.
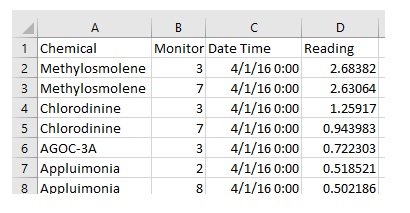
The given dataset (Sensor Data.xlsx) provide 3 months reading in the following format:
- Chemical: Which one of the four chemicals detected by the sensors
- Monitor: Which one of the nine sensors picking up the reading
- Reading: The air sensor detected amount in parts per million
- Date Time: The date and time of day of the reading, local time with no change for Daylight Savings.
Transformation :
In task#1, we identify duplicate chemical name in the date in which there is missing chemical. We will be using excel formula to remove the change the duplicate name from AGOC-3A to Methyosmolene.
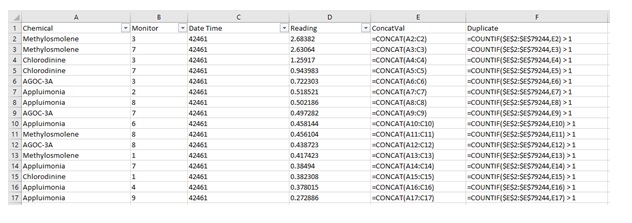
1. Create two new column “ConcatVal” & “Duplicate” to check for duplicate data.
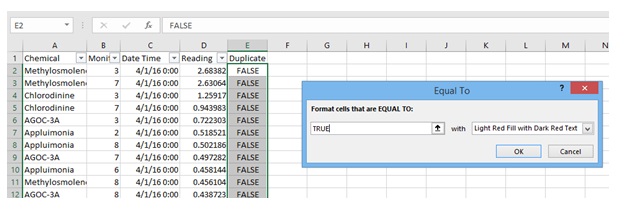
2. We copy the result computed from column F formula and paste with value only (past special), to create a separate column which contain only ‘TRUE’ or ‘FALSE’. We will be using the newly created column, and the existing Column E and F could be removed.
3. Next we format the cell using ‘Conditional Formatting’ to format the cell colour to Light Red if it is containing ‘TRUE’ for the Column Duplicate
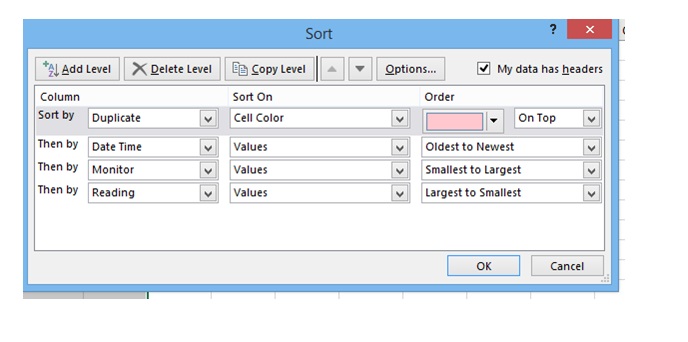
4. We perform a custom sort on all the column with the following sorting setting. The sort will place all the duplicate value on top, following by the order of their Date Time, Monitor and Reading. So that the duplicated value with higher reading will be on top of it:
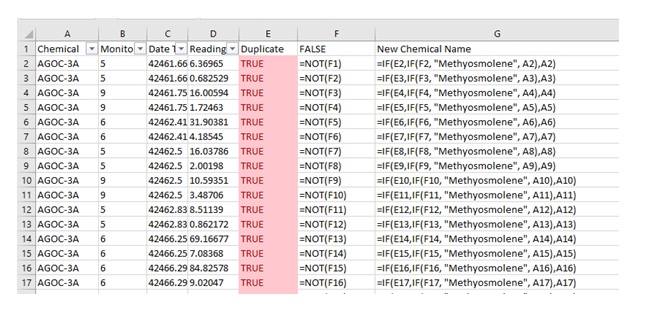
5. With the result we got from sorting, the first value will have a higher reading compared. Hence, we can apply the following formula to create the new chemical name.
Once we have generate the new chemical name, we need to do a paste special with value to replace the existing chemical. With that, we have clean our Sensor Data. We can remove the uncessary column and import into tablue for Task #2 onwards.
After we have import into tableu, we generate the following chart and there shoud be not any more unexpected behaviour:
Task
Task #1 – Sensors’ Performance and Operation
Characterize the sensors’ performance and operation. Are they all working properly at all times? Can you detect any unexpected behaviours of the sensors through analyzing the readings they capture?
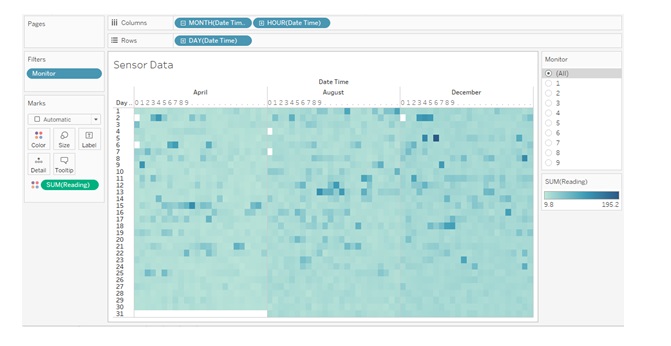
The heatmap above shows the total chemical readings of all 9 monitor in the 3. The colour indicates the amount of the reading detect by the monitor as per hour of each days. From the heatmap, we could identify empty grid which indicate that there’s no reading in that specific date and time. \\
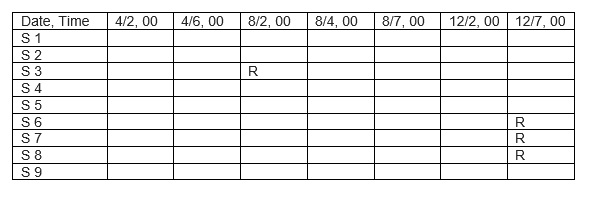
Recording down the specific date and time of each monitor with empty grid, we will derive the following table: (R = There’s reading)
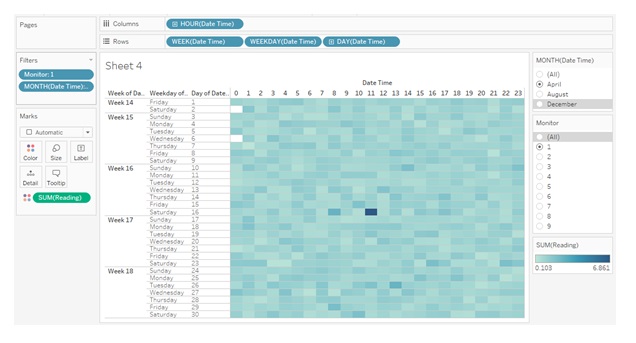
From the table, there’s an obvious pattern in which all the downtime occurs at the 00 hours of the day. To investigate future into the downtime, we include the Week number and Day of Week of the Datetime into the heatmap to find out which day of the month does those occur on
By filtering and iterating the heatmap through the different month from the graph above, the days in which the downtime occurs tend to fall within the first 2 week of the month.
To conclude on the finding we had gather above, we could assume that the datetime we had obtained from the table above are high likely the planned downtime of the sensor. Those might be the cases of maintenance to the sensor or some condition which cause the sensor not to capture any reading. While those cell with reading, they are consider as not working properly as those were supposed to be the schedule downtime period, and it shouldn’t capture any reading.
The datetime which the sensors are not working properly are:
- 8/2/2016 00hr - Sensor 3
- 12/7/2016 00hr – Sensor 6, 7 and 8
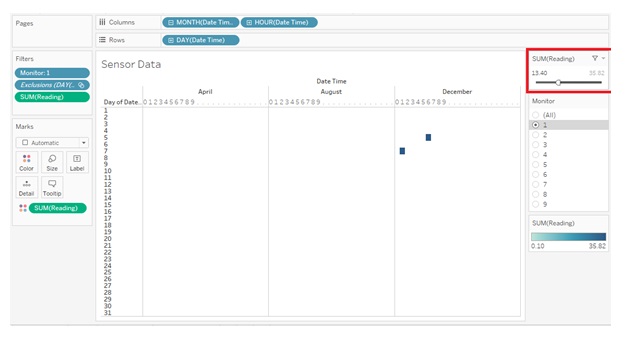
While iterating through the different month and senor, we spotted a few outstanding cells which had a jump in the reading value. Those could be identified by the high reading value or deep dark colour of the heatmap. Therefore, we will proceed to investigate further into those significant high value cells.
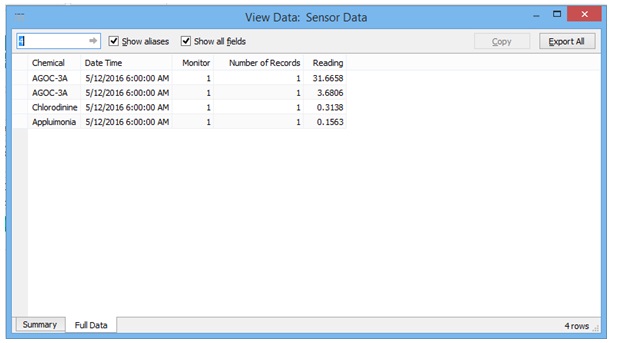
By investigating deeper and looking at the full data of the reading as shown above, there’s a duplicate record of the same chemical (AGOC-3A) while the records is missing another chemical (Methylosmolene) reading in the same datetime. We include a filter on the reading as showed above, to ease the process of identifying those records which have high reading value. In view of those high reading record, we could find a similar pattern occurring, when there is a duplicate chemical of AGOC-3A with one of the reading being significantly high, there will be a missing chemical of Methylosmolene as show in the image of the ‘Full Data’. This strange pattern occurs for multiple instances, and it inspires us to detect further for the reason of this phenomenon.
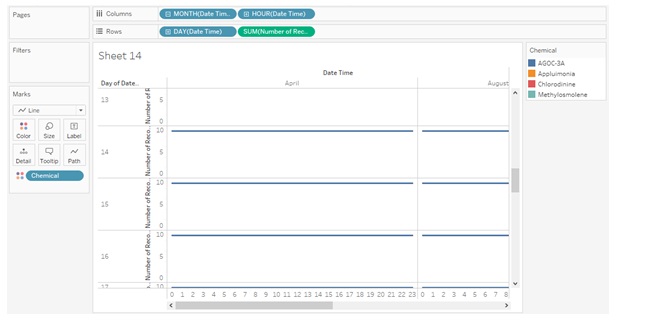
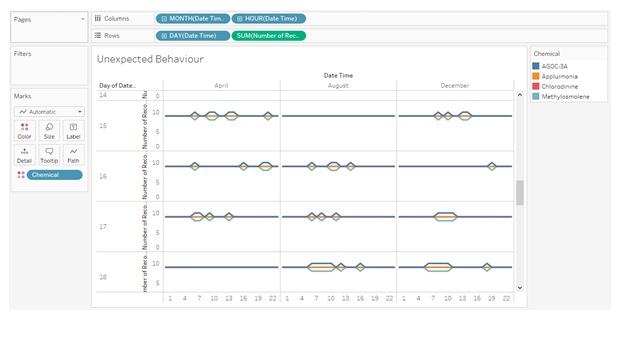
Analysing on the Number of Record capture by the sensor for each chemical, we could identify an unexpected behaviour as shown above. At every hour, there should be 9 records since there are 9 sensors in total to capture the reading. However, based on the graph above, that am not the expected result. When there’s an increase in the number of records for the chemical AGOC-3A, there will be an exact drop in number of record for the chemical Methylosmolene.
This pattern could be seen commonly throughout the different month on different date and time, and the pattern only applicable to two different chemicals. Referencing back to the background information of the chemical stated above, AGOC-3A is the least harmful while Methylosmolene is the most harmful among the chemicals captured. In additional to the background knowledge, this occurrence of the unexpected behaviour are probably intentional caused as only those two chemicals are been affected.
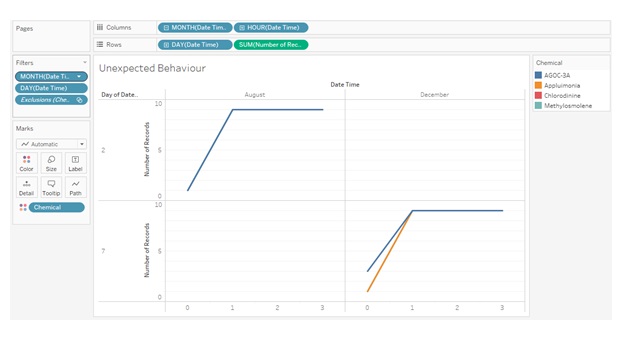
This could be further proof by focusing on the datetime in which the sensor is supposed to be ‘not working properly’.
From on the graph above, AGOC-3A was capture on 8/2/2016 00hr while AGOC-3A and Appluimonia was capture12/7/2016 00hr. Although Appluimonia is not as less harmful compared to AGOC-3A, it is still considered one of the less harmful chemical among the 4-different chemical.
In conclusion to the finding we had, the causes of the unexpected behaviour among the sensor is high likely due to intentional act. This might be due to the factory wanting to cover for the high release amount for Methylosmolene (most harmful chemical) with AGOC-3A (least harmful chemical). Hence, we could assume that the higher end of the duplicate value belongs to Methylosmolene instead of AGOC-3A.
Transformation will be done to the data based on the finding from above, in which the higher end of the duplicate value the chemical will be replaces to Methylosmolene. The steps for the data transformation is mentioned above in the Sensor Data segment. For our subsequent finding, we will be using the transformed data.
Task #2 -Chemicals detect by Sensor
Now turn your attention to the chemicals themselves. Which chemicals are being detected by the sensor group? What patterns of chemical releases do you see, as being reported in the data?
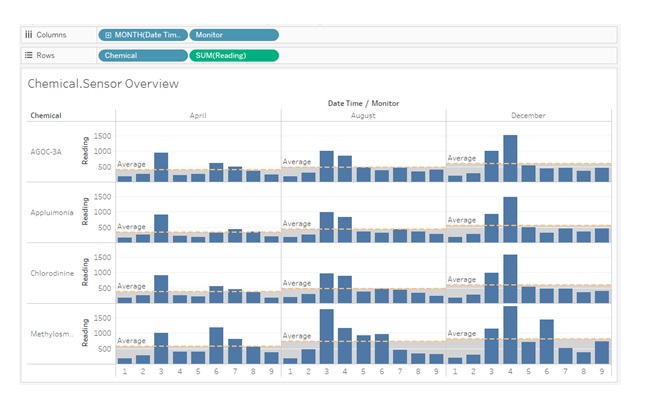
The graph above shows an overall pattern of the reading of different chemicals in 9 monitors in the three months. The reference shows the average reading capture per month for each chemical reading. As can be seen, there’s an increasing trend in the average reading for all chemical across the month. This could indicate that the factories are being more active as the month goes by, which cause the amount of chemical product to increase over the months. Next, looking at the individual Monitor. Monitor 3 shows a high reading value across the chemical and is always above the average reading. A clear pattern could be seen on monitor 4 in which the reading value has significantly increases over the 3 months. The reading value is below average in April and it increased to above the average reading in August, and finally the reading in December exceed monitor 3 results and it had the highest reading values across all the chemical.
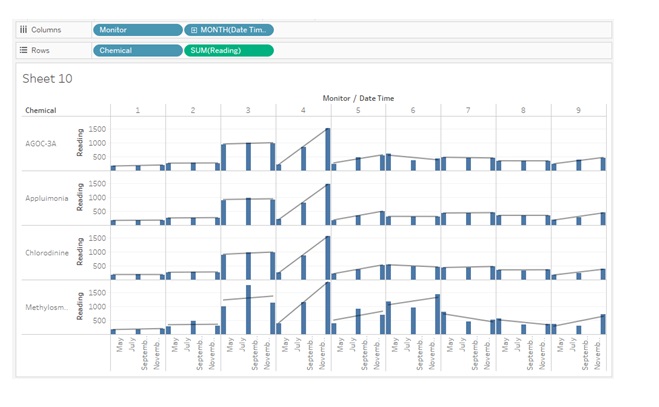
Investigating further into the trend of the chemical reading across the 3 months for each monitor and chemical, we plot the following graph above. The trend line pattern across the monitor for Appluimonia and Chlorodinine are identical to each other, and most of them are identical to AGOC-3A as well. Methylosmolene has the most different pattern compared to the other chemical, this might due to the different output amount of Methylosmolene compared to the rest.
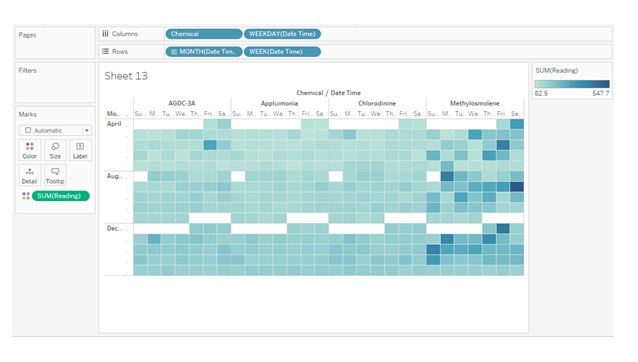
Looking at the reading value of each chemical each day across the 3 months, it proofs our assumption earlier which the output amount of Methylosmolene is different compared to the rest. From the graph above, the reading value for Chlorodinine, Appluimonia and AGOC-3A are similar to each other whereas Methylosmolene have more high reading value on quite a handful of days. The occurrence of high reading for Methylosmolene seen to be quite often as well as shown above. The indicate that Methylosmolene has been release frequently by the factories.
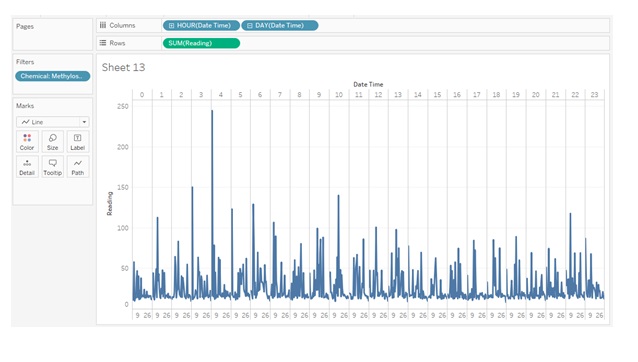
Then we break down more to focus more Methylosmolene on the hourly release pattern across the days to find out which hour of the days does the release of Methylosmolene is the highest. Since Methylosmolene is the most harmful among the chemical and has been releasing higher amount. From the graph above, we could identify the release of Methylosmolene was high from 0:00 to 6:00. Those fall into the wee hour which most people will be still sleeping and won’t know and realise the chemical is been release into the air.
Task #3 – Factories responsible for chemical release
Which factories are responsible for which chemical releases? Carefully describe how you determined this using all the data you have available. For the factories you identified, describe any observed patterns of operation revealed in the data.
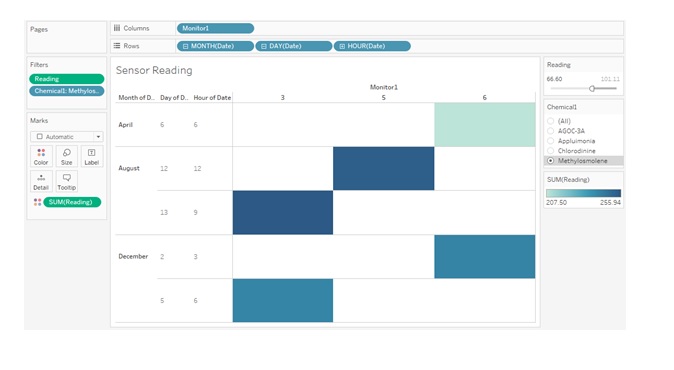
With the interactive heatmap above, we use the filtering to identify all the date time with high reading of each chemical. For the reading, we use highest 5 reading to determine which factories are responsible for the chemical releases. Hence, with that we can derives following table bellows:
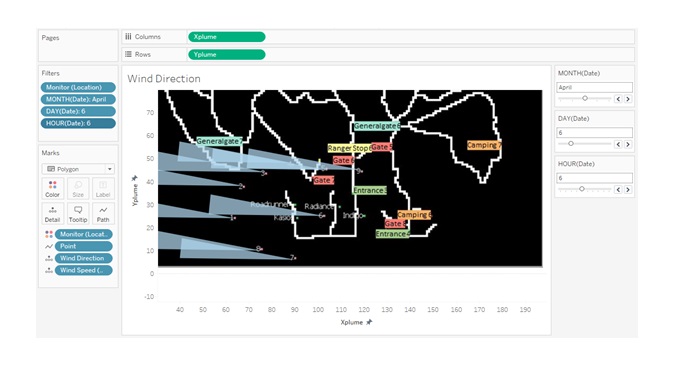
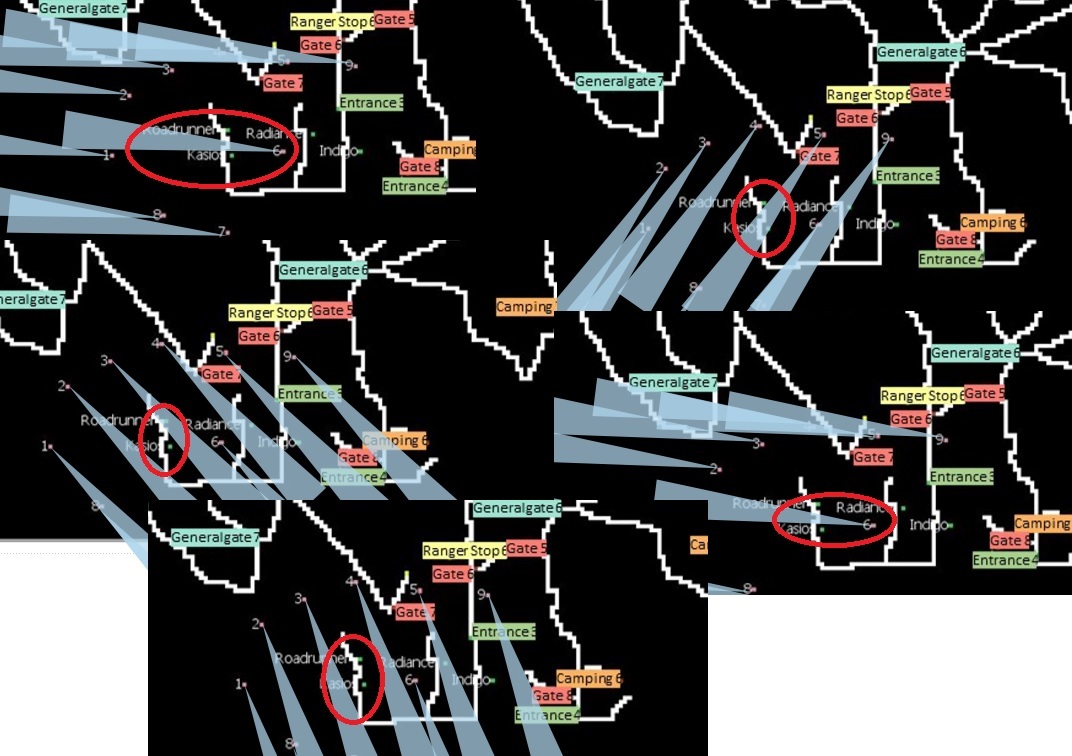
Using the wind direction mapping graph above, by specific the particular date and time, we are able to get the wind direction of that datetime. With that we can map out the factories that are involved in contributing to the release of the chemical.
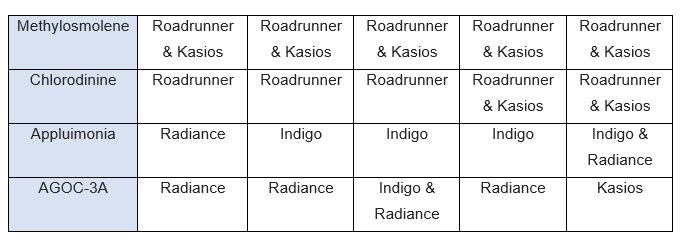
The above images show the factory that had been identify which have contributed to the release of Methylosmolene. By repeating the same process for all the chemical. We will have derived with the following table:
Based on the table derived above, we could conclude the factories that are responsible for releasing for the chemical. And we arrive at the following conclusion
Comments
Credits
Plotting of the Wind Direction was done with the help of Tan Kun Sheng
IS428 main page Link : IS428 Main Page
Assignment Overview Link : Assignment Overview
Assignment Dropbox Link : Assignment Dropbox
