Course information
|
|
|
|
|
|
Contents
Synopsis
Data analysis and communications can be fun! With visual analytics techniques and tools, everyday data analysts from various disciplines such business, economic, sociology, political science and public policy can now synthesize information and derive insight from massive, dynamic, ambiguous, and often conflicting data without having to deal with complex statistical formulas and programming. Many companies and organization took notice when Gartner cited visual analytics as one of the top five trends transforming business intelligence.
In this course, students learn how to use data visualization and interactive analytic tools and techniques to interact with data of different formats from various sources, explore the expected relationships and discover unexpected correlations and patterns. You will also acquire the skills for building cutting edge visual analytics application based on principles and best practices from graphic design, visual arts, perceptual psychology, cognitive science and interfaces design.
For more detail information and learning outcome please refer to the course design document. [1]
Learning Objectives
Upon successful completion of the course, students will be able to:
- Understand the basic concepts, theories and methodologies of Visual Analytics.
- Analyse data using appropriate visual thinking and visual analytics techniques
- Present data using appropriate visual communication and graphical methods.
- Design and implement cutting-edge Visual Analytics system for supporting decision making
Basic Modules
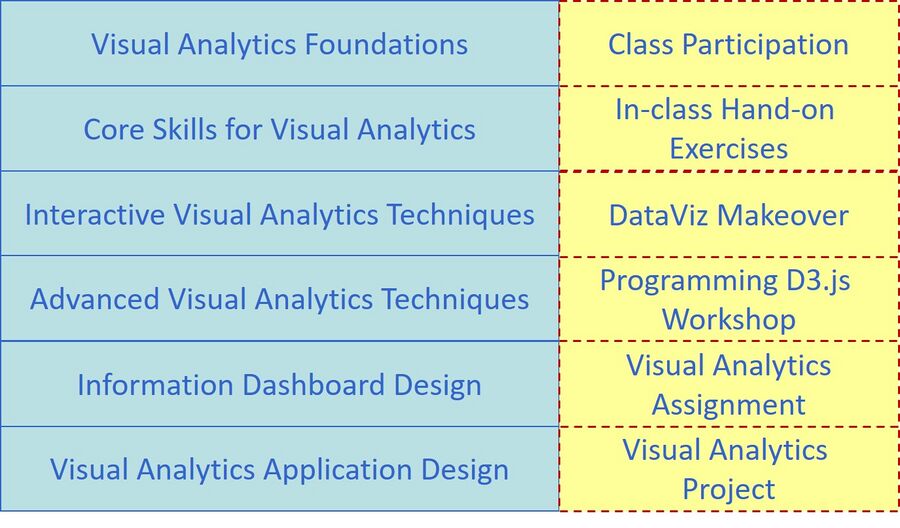
This course comprises ten integrated components as shown below:
Course Assessment
The assessment of this course consists of four major components, namely: class participation, individual assignment, DataViz makeover, visual analytics project. There will be no mid-term test or final examination for this course.
Class Participation
A strict requirement for each class meeting is to complete the assigned readings and to try out the hands-on exercises before coming to class. Readings will be provided from the textbook on technical information and from provided documents and articles on business applications of Visual Analytics. Students are required to review the recommended readings and class exercises before coming to class. Without preparation, the learning and discussions would not be as meaningful. Student sharing of insights from readings and hands-on exercises of assigned materials in class participation will form a large part of the learning in this course.
DataViz Makeover
Each week, I will post one or two data visualisation and you are required to critic, suggest ways for improvement and rework the data visualisation. Maybe you retell the story more effectively, or find a new story in the data. I am curious to see the different approaches you all take.
The purpose of the makeover is to improve on the original visualisation. Focus on what works, what doesn’t work, why those things don’t work, and how you made it better. You should try stick to the fields in the data set provided and improve upon the original visualisation. However, if supplementing the data helps you tell a better story, go for it!
You are required to upload the weekly makeover onto the dropbox of e-Learn (i.e. LMS) by Sunday before mid-night 11.59pm.
Individual Assignment
There is one assignment that is due throughout the term. Students may work together to help one another with computer or Visual Analytics issues and discuss the materials that constitute the assignment. However, each student is required to prepare and submit the assignment (including any computer work) on their own. Cheating is strictly forbidden. Cheating includes but not limited to: plagiarism and submission of work that is not the student’s own.
Students are required to edit their assignment onto the course wiki. The submission should provide a detail and accuracy descriptions of the methodology and data visualisation techniques used, and the findings of the analysis. The assignment artifact due, on the other hands, is to be uploaded into the Assignment Dropbox strictly before the official due dates. Late work, will be severely penalised. Students must check and confirm on Wiki the assignment due dates.
Visual Analytics Project
The purpose of the project is to provide students first hand experience on collecting, processing and analysing large business data using real world data. A project may involve developing new methods or implementing visual analytics system to support analytic tasks in specific domains. Alternatively, a project may be in the form of application development by integrating analytical tools within a visual analytics environment. Students are encouraged to focus on research topics that are relevant to their field of study. It should address a concrete visual analytics problem and should propose a novel and creative solution.
For more details please refer to Visual Analytics Project page
Grading Summary
The grading distribution of this course is as follows:
- Class Participation 10%
- DataViz Makeover 30%
- Assignment 20%
- Visual Analytics Project 40%
- Project wiki 15%
- Project poster 5%
- Townhall presentation 5%
- VA application 15%

