IS428 2017-18 T1 Assign Tan Zhi Chong
Contents
Problem and Motivation
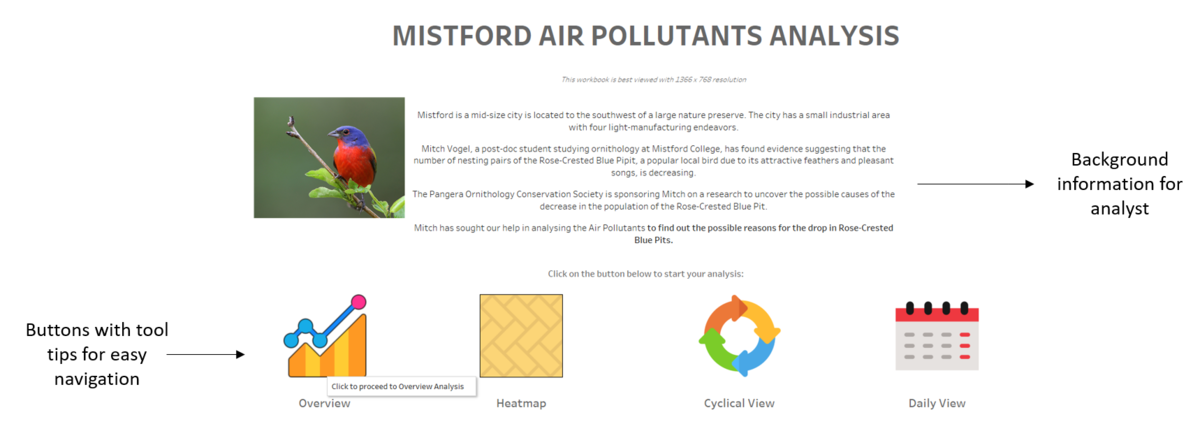
Mistford is a mid-size city is located to the southwest of a large nature preserve. The city has a small industrial area with four light-manufacturing endeavors. Mitch Vogel, a post-doc student studying ornithology at Mistford College, has found evidence suggesting that the number of nesting pairs of the Rose-Crested Blue Pipit, a popular local bird due to its attractive feathers and pleasant songs, is decreasing. The Pangera Ornithology Conservation Society is sponsoring Mitch on a research to uncover the possible causes of the decrease in the population of the Rose-Crested Blue Pit.
With access to the following data:
- Sensor Data – Hourly readings of the chemical levels detected by the 9 monitors
- Meteorological Data – Wind Direction and Wind speed collected on 3 hours intervals
- Monitor Data – X and Y Coordinates of the 9 monitors
, Mitch has sought out help in analysing these datasets to find out the possible reasons for the drop in Rose-Crested Blue Pits.
Background Information
Manufacturing Companies near Mistford
| No. | Manufacturing Companies | Description |
|---|---|---|
| Roadrunner produces personal fitness trackers, heart rate monitors, headlamps, GPS watches, and other sport-related consumer electronics. Roadrunner began as one of the region’s first fitness stores in 1962, with an eye toward outfitting the entire nation with appropriate outdoor gear. After an earthquake nearly destroyed their main warehouse in 1968, Roadrunner turned a bad situation into a glowing success with the first “slightly damaged goods” sale. After which they began to focus on manufacturing; though their “Earthshaking Bargains” business still sells dented, overstocked and refurbished items over the internet and from a small retail shop attached to their front office. | ||
| Kasios Office Furniture manufactures metal and composite-wood office furniture including desks, tables, and chairs. Kasios wants to do with desk chairs what Starbucks did for coffee – making office furniture what people must have, instead of what they just need. “Office equipment doesn’t need to be ugly!” says founder Ken Kasios. “We have redesigned all office products to be cool, fun, and hip—even your basic stapler.” Kasios business model is focused on in-store merchandising highlighting the beauty and functionality of their “user-centered design”. They recently celebrated the one-year anniversary of a distribution and merchandising agreement with the national office supply chain store PaperKlips. | ||
| Radiance produces solvent based optically variable metallic flake paints. “Metallic paints with an untarnished reputation!” quips ColourTek’s Senior Vice President Arthur Donner. “Radiance ColourTek metallic paints are worth their weight in gold.” Offering a new generation of paints in the 1970s, Radiance out marketed all competitors for three decades until manufacturing process issues began to tarnish their reputation. “We were challenged,” said Donner. “Polishing up our pearlescent pigments caused us to lose luster, but now we have the lowest VOCs (volatile organic compounds) in the industry!” | ||
| Indigo Sol produces skateboards and snowboards. Founder Billy Keys started off manufacturing wooden wine barrels for northwestern US wineries, but then navigated a course from decorative fiberglass wine barrels to making his first pair of fiberglass skis in 1971. Excellent product and sales decisions rocketed Keys Skis production to unexpected levels, until they were bought out by a large Denver, Colorado-based private investment group. Keys returned to making specialized snowboards in the 1980s, with a small company in Mistford called Indigo Sol. The company has seen modest growth in recent years. |
Chemical Readings Detected by Sensor
| No. | Chemical | Description |
|---|---|---|
| An airborne odor is caused by a substance in the air that you can smell. Odors, or smells, can be either pleasant or unpleasant. In general, most substances that cause odors in the outdoor air are not at levels that can cause serious injury, long-term health effects, or death to humans or animals. However, odors may affect your quality of life and sense of well-being. Several odor-producing substances, including Appluimonia, are monitored under this program. | ||
| Corrosives are materials that can attack and chemically destroy exposed body tissues. Corrosives can also damage or even destroy metal. They begin to cause damage as soon as they touch the skin, eyes, respiratory tract, digestive tract, or the metal. They might be hazardous in other ways too, depending on the particular corrosive material. An example is the chemical Chlorodinine. It has been used as a disinfectant and sterilizing agent as well as other uses. It is harmful if inhaled or swallowed. | ||
| This is a trade name for a family of volatile organic solvents. After the publication of several studies documenting the toxic side effects of Methylosmolene in vertebrates, the chemical was strictly regulated in the manufacturing sector. Liquid forms of Methylosmolene are required by law to be chemically neutralized before disposal. | ||
| New environmental regulations, and consumer demand, have led to the development of low-VOC and zero-VOC solvents. Most manufacturers now use one or more low-VOC substances and Mistford’s plants have wholeheartedly signed on. These new solvents, including AGOC-3A, are less harmful to human and environmental health |
*Background information is obtained from the assignment file
Dataset Cleaning Process
Issue 1: Lack of Factories Coordinates
Issue:
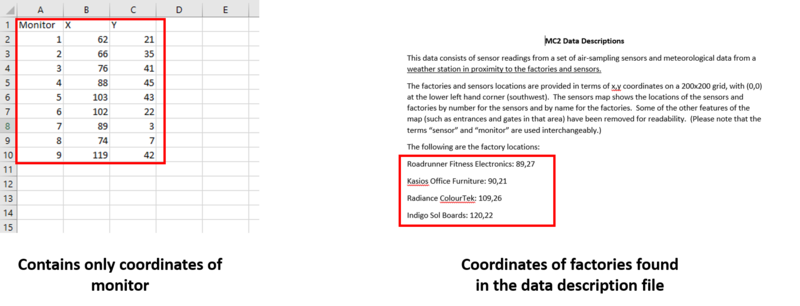
- There is only one location data provided, which shows the x and y coordinates of the 9 monitors. The data does not contain the coordinates of the factories.
- Luckily, the coordinates of the factories can be found inside the data description file.
Solution:
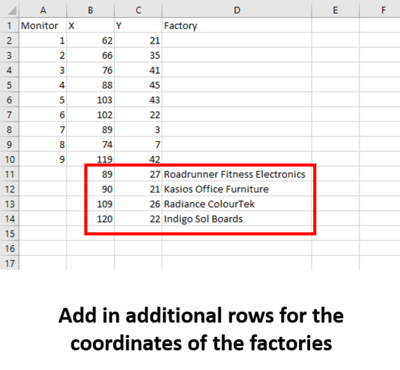
- Insert the coordinates of the factories into our location data.
- Save the file separately as “Location Data”
Issue 2: Extra Elevation Column
Issue:
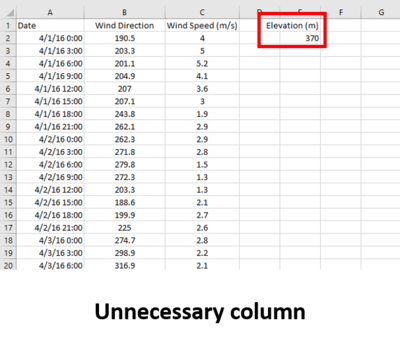
- There is an additional Elevation Column in the “Meteorological Data”.
- It might be useful if a a topographical map of the region is provided but since the only height that is provided out of all the data is the elevation, it will be difficult to make use of it
Solution:
- The elevation column will be removed since it does not add value to our analysis.
- Delete the elevation column and save the file as “Meteorological Data Cleaned”.
Issue 3: Challenge in Mapping Hours
Issue:
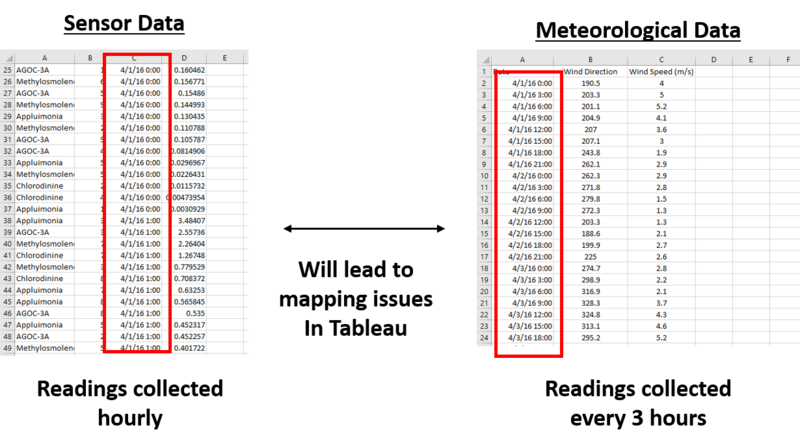
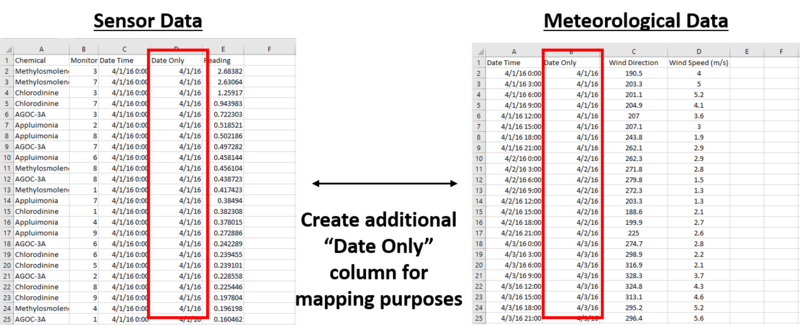
- The Sensor Data is collected hourly while the Meteorological Data is collected every 3 hours. This makes it difficult to map the Date Time columns of both data source because for every 3 hours, 2 hours will not be mapped from the Sensor Data to the Meteorological Data
Solution:
- We will map the values by date instead of date and time. This will ensure that all values will be mapped across.
- Create a separate “Date Only” column in both the Meteorological Data and Sensor Data.
- This can be easily done by copying the values from the Date Time column over to a new column, then change the format of the column to “Short Date”
- Save the edited Sensor Data and Meteorological Data as Sensor Data Cleaned and Meteorological Data Cleaned respectively.
Dataset Import Structure & Preparation Process
Once data cleaning is completed, we will import the following data files into Tableau for analysis
1. Import Data
- Import the 3 data into Tableau each as a separate data source
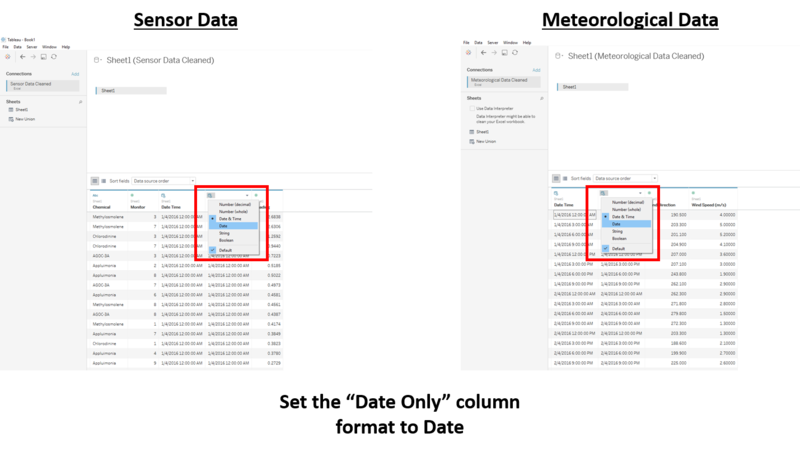
2. Change Columns to Right Format
- Ensure that the “Date Only” column is set to Date type
3. Data Blending
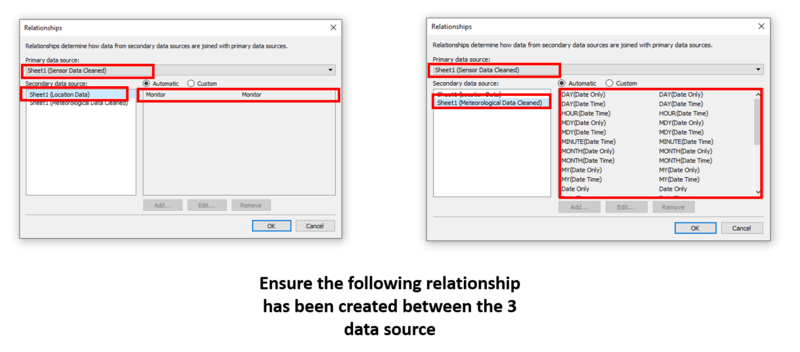
- Click on Data > Edit Relationship to edit the relationship between the data source
- Set Sensor Data as the primary data source
- Create a relationship between the Sensor Data and Location Data with the Monitor dimension. Tableau can map it automatically
- Create a relationship between the Sensor Data and Meteorological Data with the Date dimension. Tableau can map it automatically.
4. Create Parameters
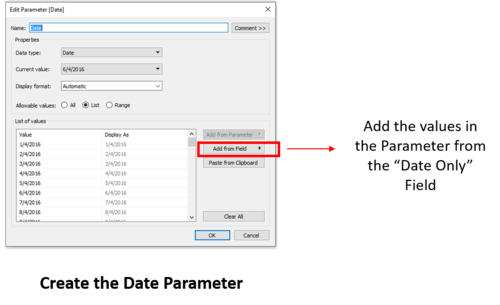
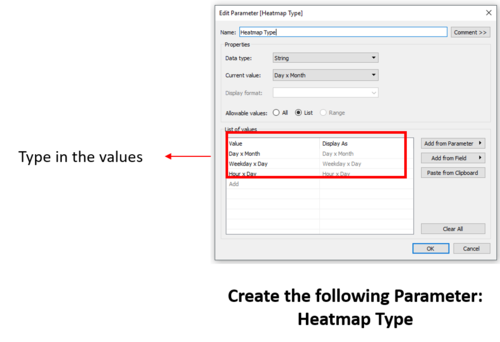
- Create the Date parameter for changing the dates on the dashboard later
- Create the Heatmap Type parameter for sheet swapping capabilities on the dashboard
5. Create Calculated Fields
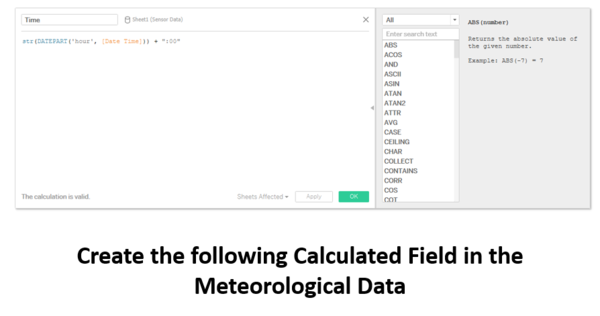
- a. Create the “Time” calculated field with the following formula
str(DATEPART('hour', [Date Time])) + ":00"
- This is done so that our time time will appear as “12:00” instead of “12”.
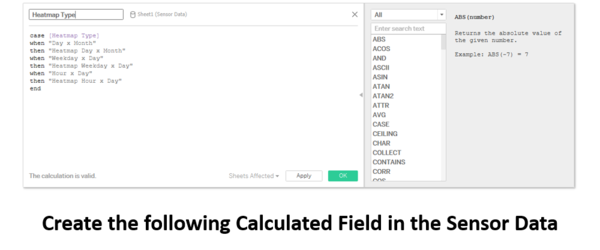
- b. Create the Heatmap Type calculated field for the sheet swapping capabilities between the different heatmaps on the dashboard
 case [Heatmap Type]
 when "Day x Month"
 then "Heatmap Day x Month"
 when "Weekday x Day"
 then "Heatmap Weekday x Day"
 when "Hour x Day"
 then "Heatmap Hour x Day"
 end
- “Heatmap Day x Month” refers to the name of my worksheet
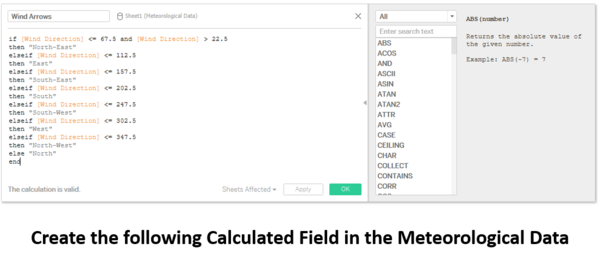
- c. Create Calculated Field for Wind Arrows
- Categorise the wind direction so that you can visualise the general direction of the wind
  if [Wind Direction] <= 67.5 and [Wind Direction] > 22.5
  then "South-West"
  elseif [Wind Direction] <= 112.5
  then "West"
  elseif [Wind Direction] <= 157.5
  then "North-West"
  elseif [Wind Direction] <= 202.5
  then "North"
  elseif [Wind Direction] <= 247.5
  then "North-East"
  elseif [Wind Direction] <= 302.5
  then "East"
  elseif [Wind Direction] <= 347.5
  then "South-East"
  else "South"
  end
6. Import Image as Background Map
- Select Map > Background images > Location Data
- Click on Add image
- Browse to open the image file of the map
- Map the X field to X and Y field to Y
- Set the left and right to 0 and 200 respectively
- Set the bottom and top to 0 and 200 respectively
- Click on the options and select "Lock Aspect Ratio" and "Always Show Entire Image"
Interactive Visualisation
The vizualisation is done using Tableau. It is best viewed with a screen resolution setting of 1366x768.
Tableau Public Link: https://public.tableau.com/profile/vincent.tan4366#!/vizhome/IS428Assignment/HomePage?publish=yes
Home Page
| No. | Interactivity | Rationale | Brief Implementation |
|---|---|---|---|
| Enhances usability with easier navigation | 1. Create an empty worksheet for the button
2. Set the marks as shape, then select the desired image 3. Add the button worksheet to the dashboard 4. Create action filter on the button worksheet |
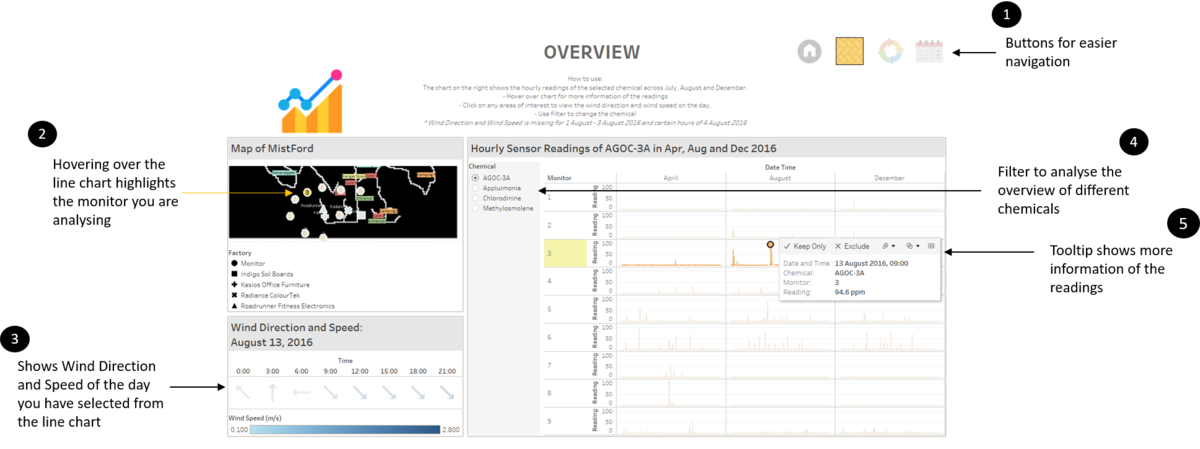
Overview Page
| No. | Interactivity | Rationale | Brief Implementation |
|---|---|---|---|
| Enhances usability with easier navigation | 1. Create an empty worksheet for the button
2. Set the marks as shape, then select the desired image 3. Add the button worksheet to the dashboard 4. Create action filter with the button worksheet | ||
| Enhances usability by allowing analyst to easily find the location of the monitor without having to search for it | 1. In both the line chart worksheet and wind direction worksheet, drag the “Monitor” dimension to details
2. Create a dashboard highlight action by hover and set the target highlighting field as “Monitor” | ||
| 1. Allows analyst to easily view the information about the wind on a particular day just by clicking on any point of interest on the line graph
2. Allows analyst to know where the air pollutants are coming from |
1. In both the line chart worksheet and wind direction worksheet, drag the “Date Time” dimension to details and select as MDY(Date Time)
2. Create a dashboard filter action by select and set the target field in the target filter as MDY(Date Time) | ||
| The graph will be too distracting if the readings for all 4 chemicals are shown.
Hence a filter is used for a clearer comparison. |
1. In the line chart worksheet, drag the chemical dimension into the filter
2. Add the chemical filter into the dashboard 3. Select single value drop down to change the form of the filter | ||
| Allows analyst to view more details about the area he is interested in | 1. On all the worksheets, click on the tooltips icon then set the desired information to be shown in the tooltips |
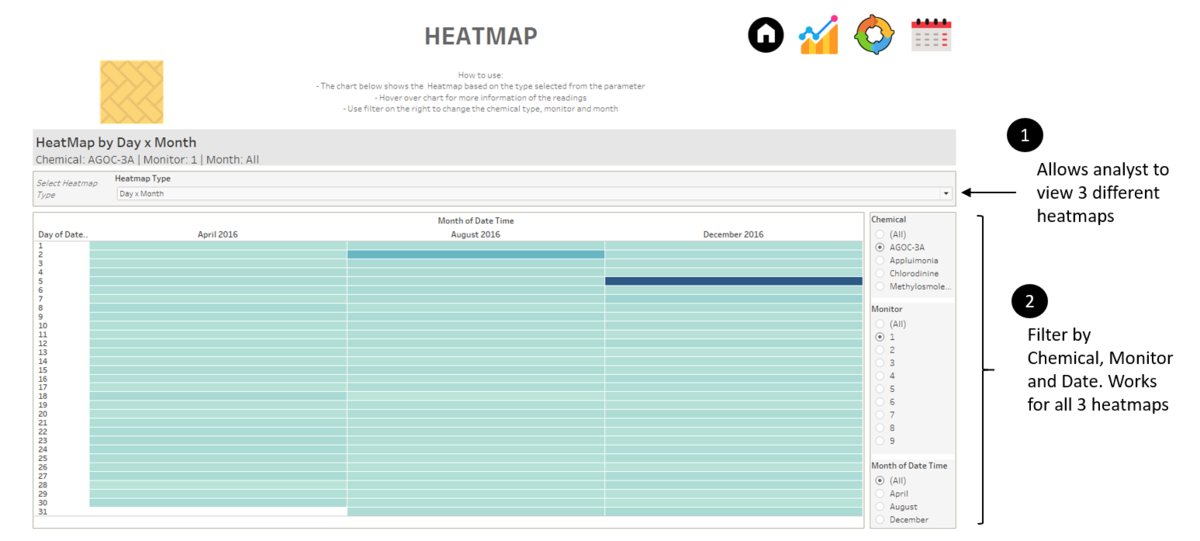
Heatmap
| No. | Interactivity | Rationale | Brief Implementation |
|---|---|---|---|
| Parameter to change the type of heatmap for analysis | Enhance usability by allowing analyst to view the different type of heatmap analysis without having to change to another page
Allows analyst to discover if there are any a) Monthly patterns b) Weekly patterns c) Daily patterns |
1. Create a parameter to change the heatmap type
2. Create a calculated field using the parameter created so that it can be used as a filter 3. Drag the calculated field that you have created to filter. Repeat this for all the different type of heatmap worksheets 4. Drag the worksheets into a layout container and hide the title of the worksheets 5. Add the heatmap type parameter in the dashboard | |
| Filter heatmap by chemicals, monitor and Date | Allows analysts to drill down and analyse the patterns for each chemicals and monitor | 1. Drag the chemical, monitor and date dimensions into filter
2. Add chemical, monitor and date filter to the dashboard |
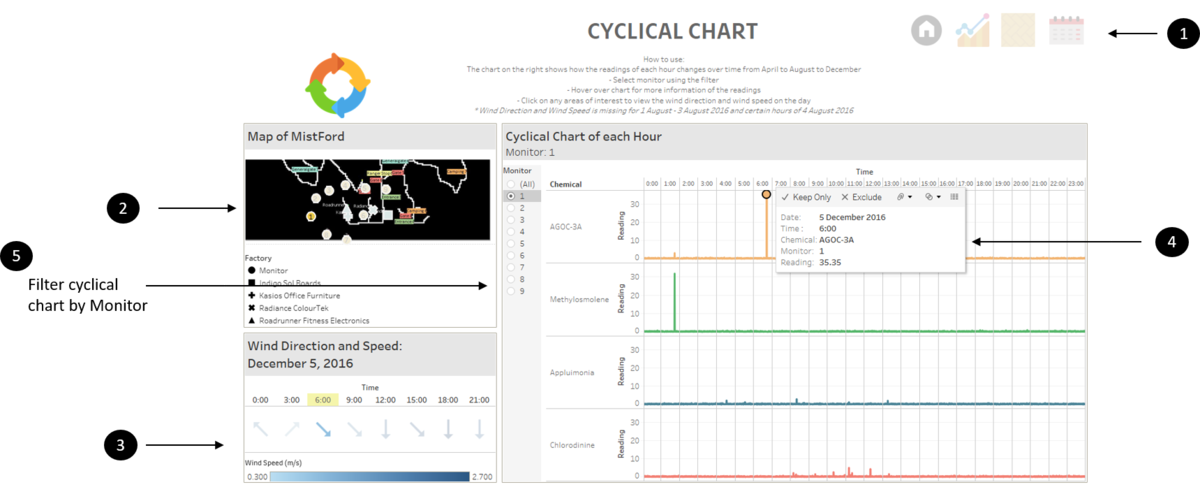
Cyclical Chart
| No. | Interactivity | Rationale | Brief Implementation |
|---|---|---|---|
| Same as Overview Page | Same as Overview Page | ||
| Allows analyst to drill down and find the hourly patterns for each monitor | 1. Drag the monitor dimension to filter
2. Add monitor filter to dashboard |
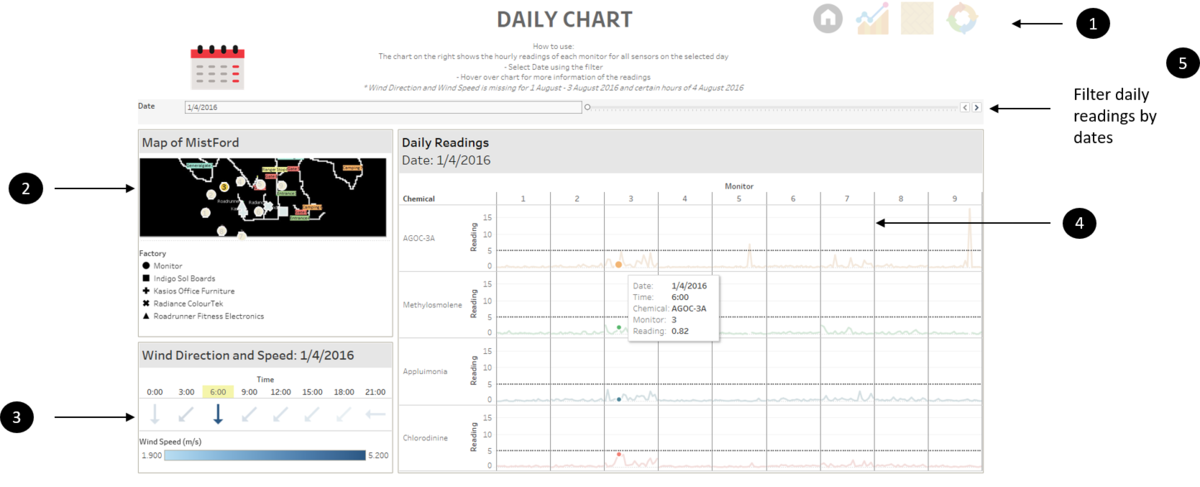
Daily Chart
| No. | Interactivity | Rationale | Brief Implementation |
|---|---|---|---|
| Same as Overview Page | Same as Overview Page | ||
| Allows analyst to see the detailed view of the hourly readings on every single day to discover daily patterns between the monitors | 1.Drag date time dimension to filters in both the wind direction work sheet and the daily chart worksheet
2. Set the filter by conditional formula 3. Add parameter to dashboard |
Specific Tasks
Task 1
Characterize the sensors’ performance and operation. Are they all working properly at all times? Can you detect any unexpected behaviors of the sensors through analyzing the readings they capture? Limit your response to no more than 9 images and 1000 words.
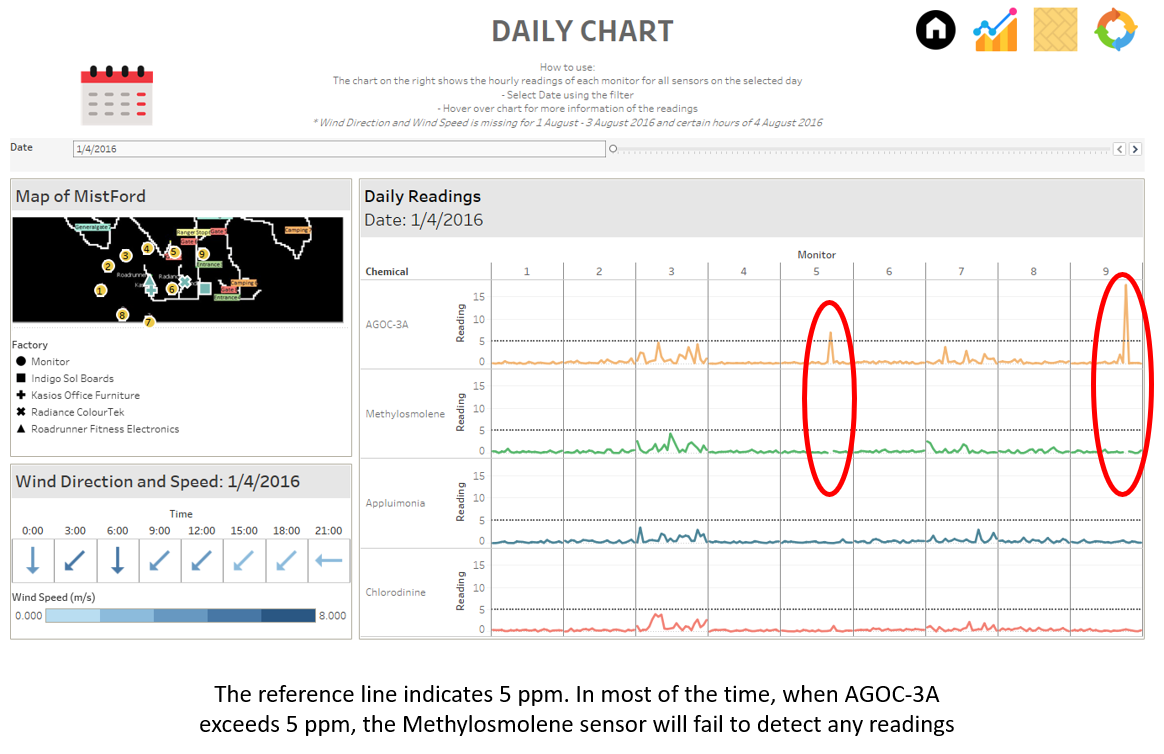
1. The Methylosmolene sensor for all monitors failed to detect any readings occasionally. There isn’t any distinct pattern when this normally happens but it usually happens when the readings of the AGOC-3A reading is greater than 5 ppm. In a few rare occasions, small spikes in readings of AGO3-CA readings also led to the failure of the Methylosmolene sensor. As a result of this error, it is impossible to determine if Methylosmolene reading fluctuates together with AGO3-CA readings.
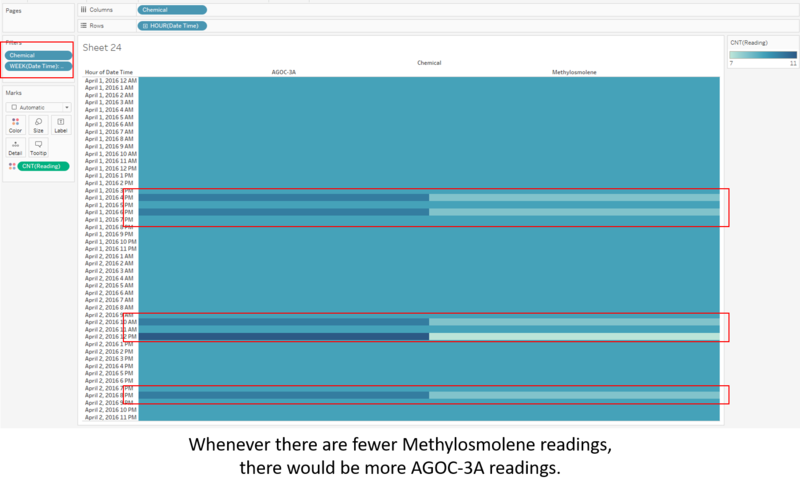
Upon closer inspection, it is discovered that whenever the Methylosmolene reading is missing, there would be a higher number of readings for AGOC-3A. Thus, it seems that there is an error which might have misclassified the readings, resulting in the lack of Methylosmolene readings. This means that there is an upwards bias for AGOC-3A readings at this timings. It is uncertain which of the two readings belong to which chemical but based on the trend, the higher value should probably be AGOC-3A.
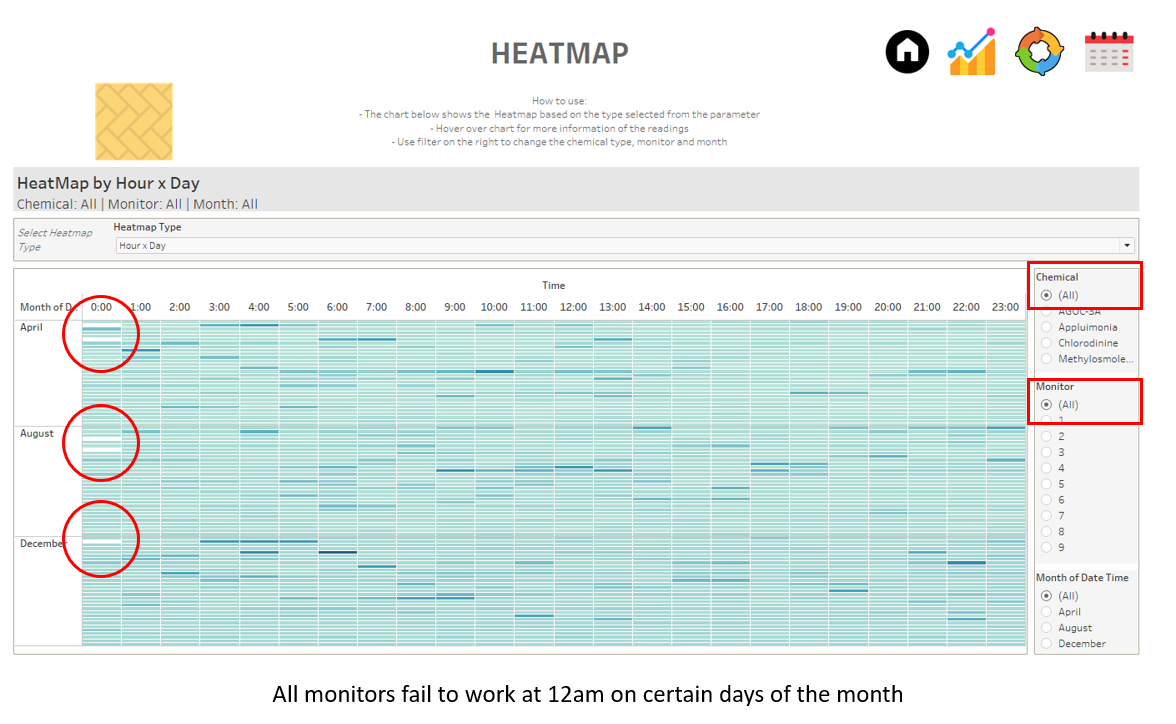
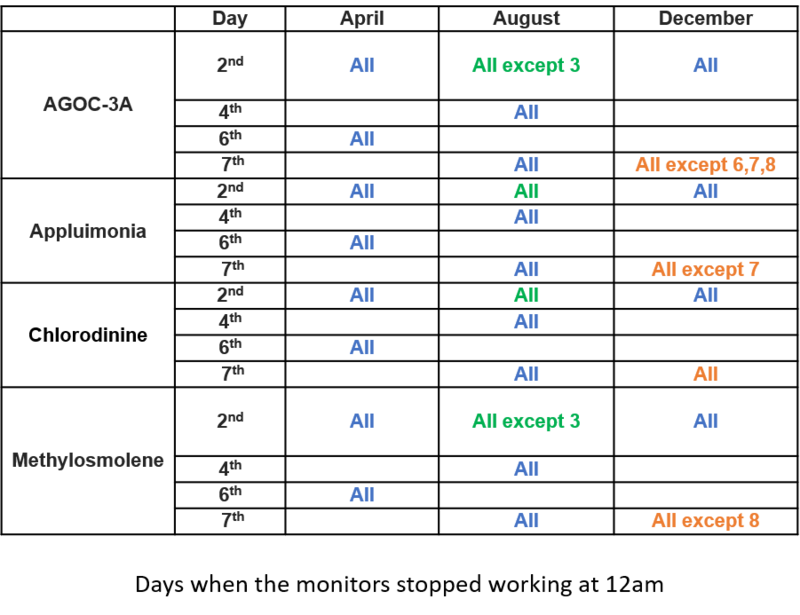
2.The monitors seem to stop working at 12 am on certain days of the month
- There are some days when all the monitors of all sensors stopped working. They are - 2nd April, 6th April, 4th August, 7th August and 2nd December. Those are highlighted in blue in the table.
- In addition, on 2nd August, all the monitors and sensors stopped working except for the AGO3-CA and Methylosmolene sensor of Monitor 3. They are highlighted in green.
- Furthermore, on 7th August, most of the sensors seem to stopped working except for a few. More details could be found in the table. They are highlighted in brown.
Task 2
Now turn your attention to the chemicals themselves. Which chemicals are being detected by the sensor group? What patterns of chemical releases do you see, as being reported in the data? Limit your response to no more than 6 images and 500 words.
1. In general, Appluimonia and Chlorodinine readings are quite low as they never exceed 10ppm. However, there are still fluctuations and spikes, indicating that there are possible emitters in the region.
2. In general, AGOC-3A and Methylosmolene seem to be low most of the time however there are spikes in readings on certain occasions. The spikes in the reading could be up to 120ppm, which is quite high.
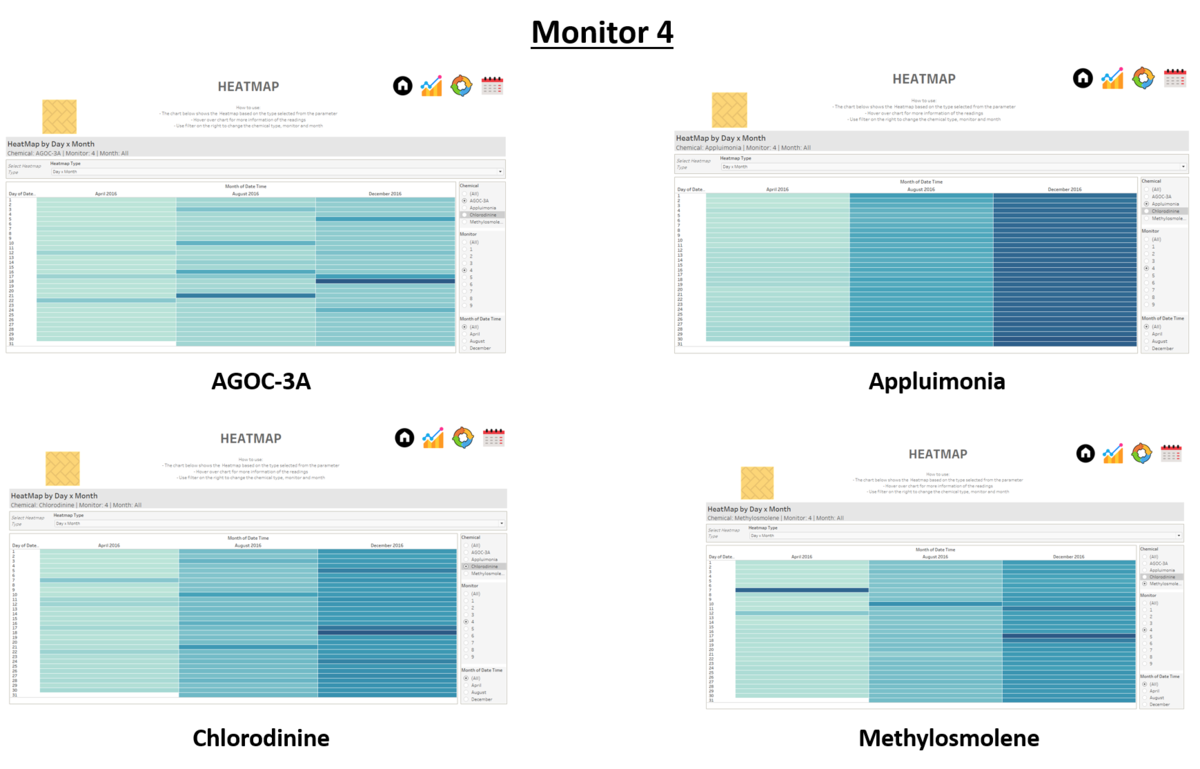
3. Monitor 4 seems to be detecting an increase in readings of all 4 chemicals from the month of April to August to December.
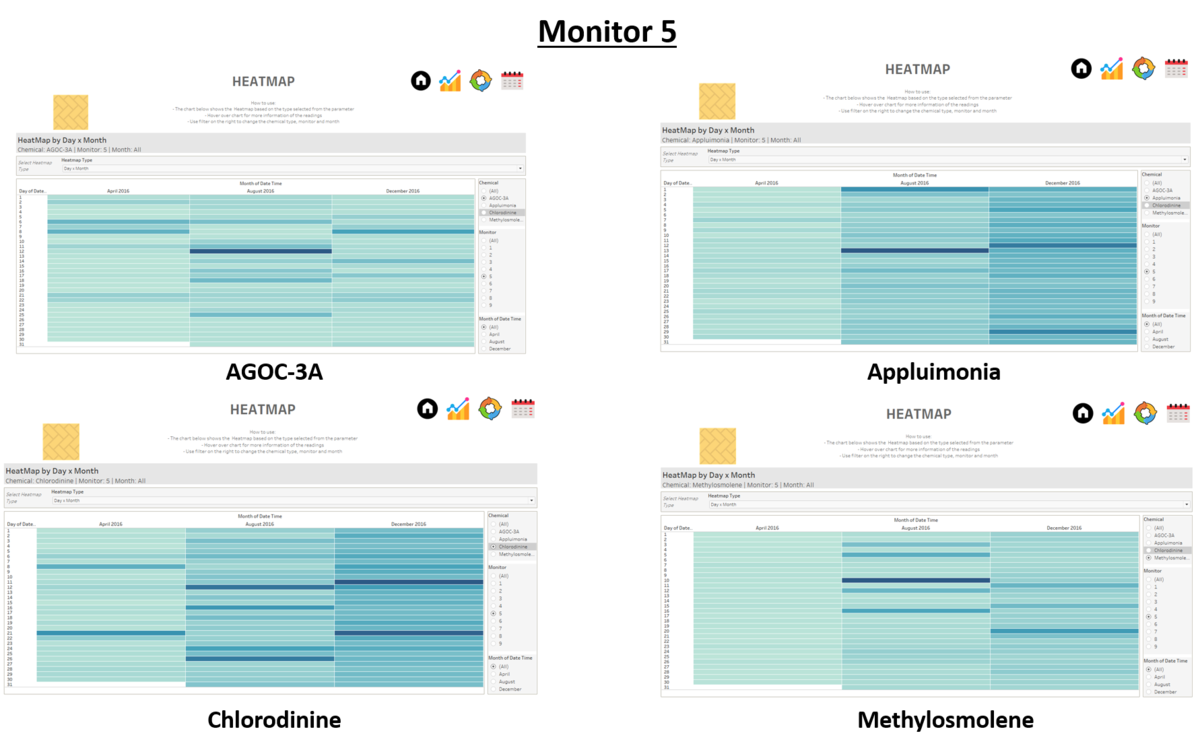
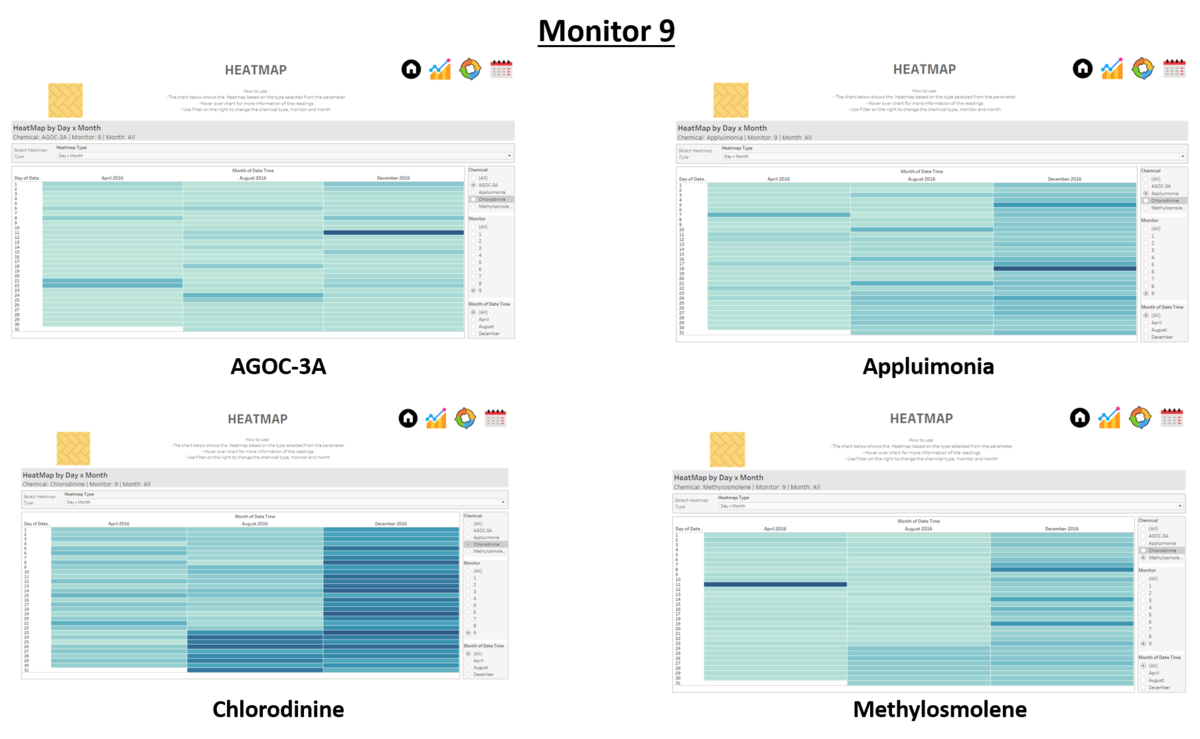
4. Monitor 5 and 9 also seem to be detecting an increase in readings of Appluimonia, Chlorodine and Methylosmolene from the month of April to August to December. It is uncertain why that is so because monitor 4, 5 and 9 are relatively far from the factories. Monitors closer to the factories such as monitor 6 do not seem to be registering any increase in chemical levels of the chemicals.
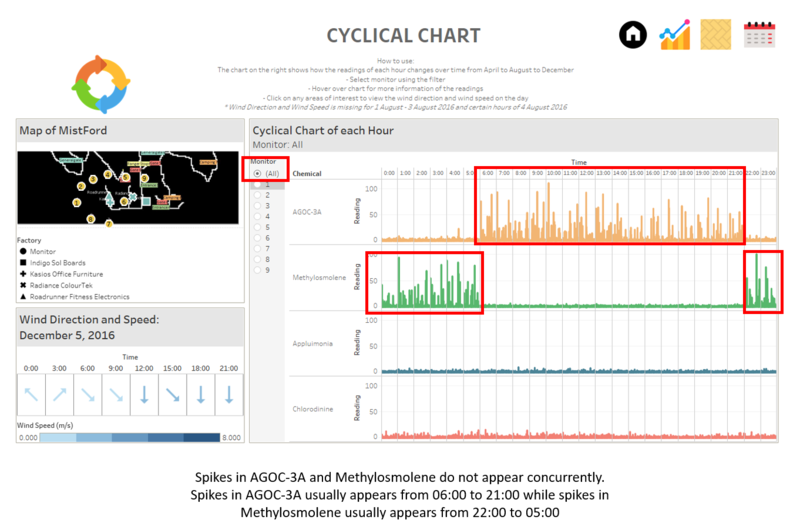
5.The spikes in AGOC-3A readings tend to occur from 6 am to 9 pm across all 9 monitors. On the other hand, spikes in Methylosmolene seem to occur from 10 pm to 5 am, which is the opposite of the release of AGOC-3A. As discussed previously, AGO3-CA tends to interfere with the readings of Methylosmolene. Hence, it is uncertain if the spikes in Methylosmene only happen during this period because of the low AGO3-CA readings during this time.
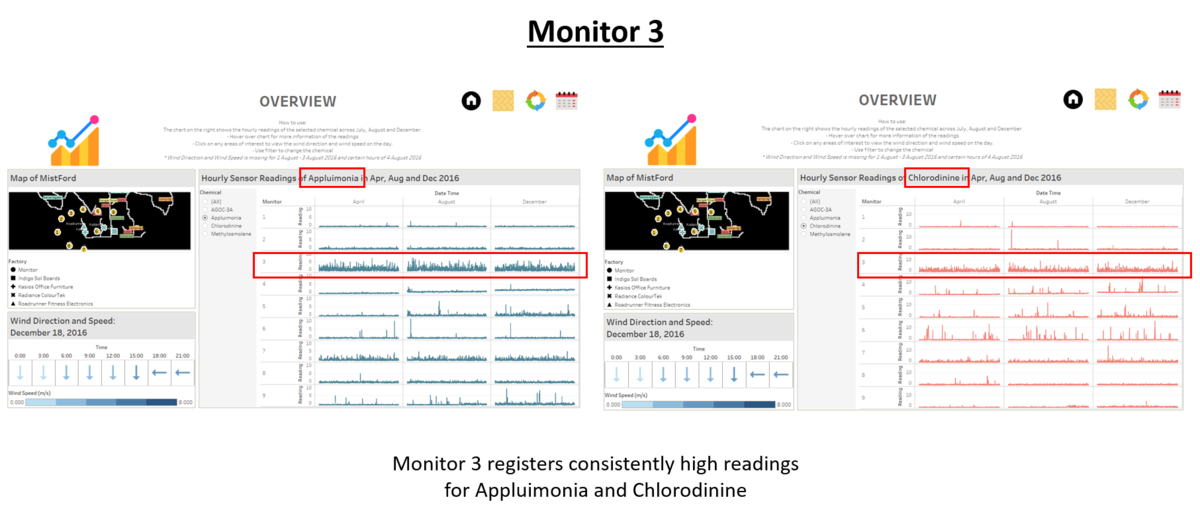
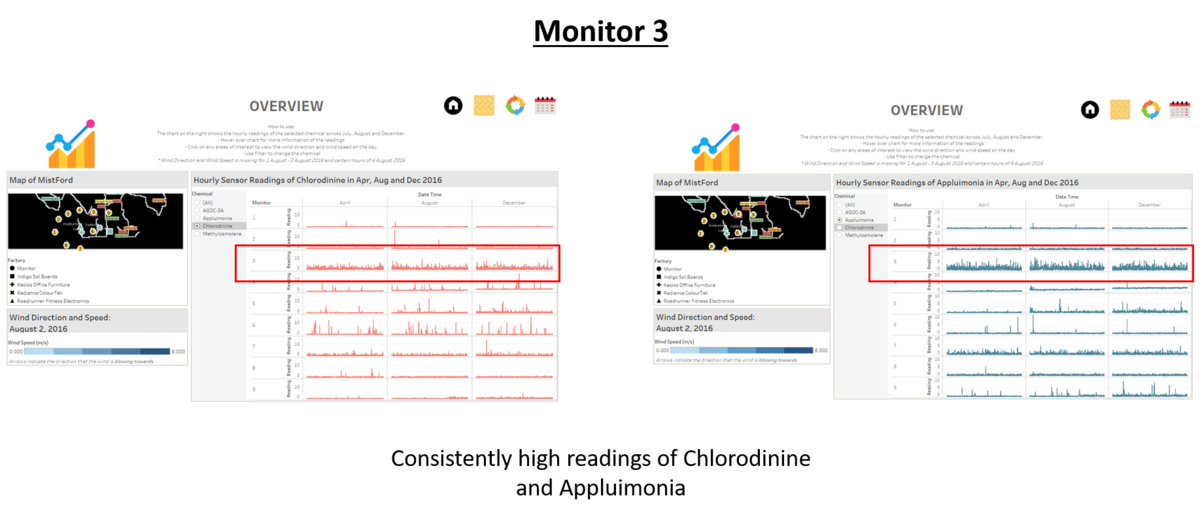
6. Monitor 3 registers consistently high readings for Appluimonia and Chlorodine. It could be that this monitor is close to a source of release or it could also be that this monitor is more sensitive to readings than the other monitors.
7. The highest spike in AGOC-3A readings is at monitor 8 with 111.5 ppm on 15 April 2016, 10 am. Wind direction is blowing to the south-west direction with low speed.
8. The highest spike in Appluimonia readings is at monitor 6 with 10.15ppm on 2 August 2016, 2016, 8 am, no wind data for the day.
9. The highest spike in Chlorodine readings is at monitor 2 with 15.72 ppm on 2 August 2016, 6 am, no wind data.
10. The highest spike in Methylosmolene readings is at monitor 6 with 100.8 ppm on 8 December, 2016, 10pm , wind direction is blowing to the north-east direction with medium speed.
11. Monitor 6 has the most number of spikes for Chlorodine, AGO3-CA and Methylosmolene, which is no surprising as it is closest to all the factories
Task 3
Which factories are responsible for which chemical releases? Carefully describe how you determined this using all the data you have available. For the factories you identified, describe any observed patterns of operation revealed in the data. Limit your response to no more than 8 images and 1000 words.
Monitor 6
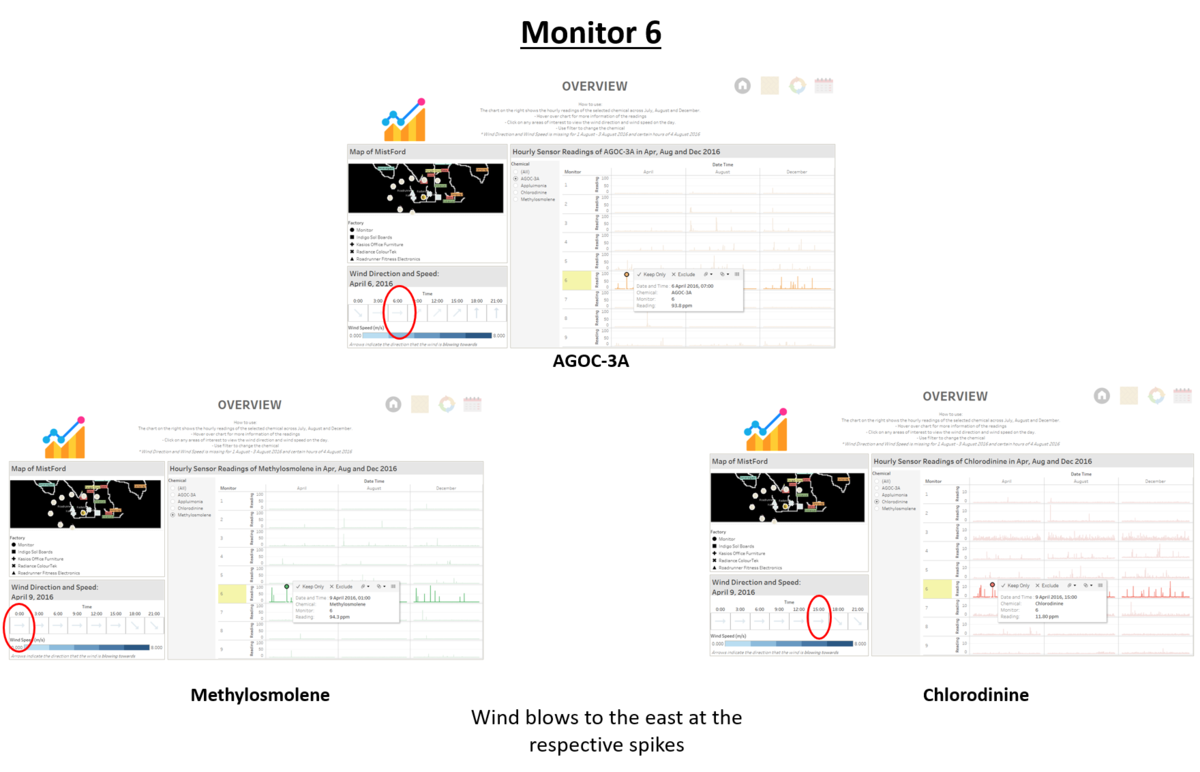
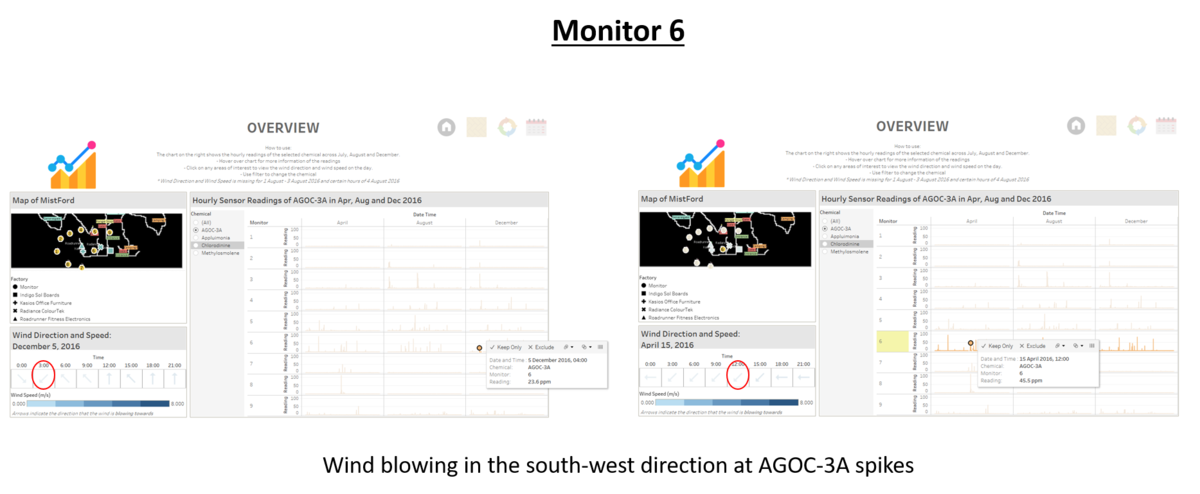
1. As monitor 6 is the closest monitor to all the factories, we could analyse the correlation of the spikes in the readings with the wind direction to determine the source of the chemical. For AGOC- 3A, it appears that whenever there is a spike, the wind tends to be blowing to the east and south-east direction. The highest spikes tend to occur when the wind is blowing towards the east direction. This tells us that the chemical source is from the west direction, where Kasios Office Furniture and/ or Roadrunner Fitness Electronics are located.
2. It appears that the same pattern shows up in both Methylosmolene and Chlorodine readings. Once again, the spikes in both Methylosmolene and Chlorodine seem to appear when the wind is blowing towards the east and south-east and the highest peak occurs when the wind is blowing towards the east direction. Hence, we can conclude that apart from emitting AGOC-3A, Kasios Office Furniture and/ or Roadrunner Fitness Electronics are also responsible for the release of Methylosmolene and Chlorodine.
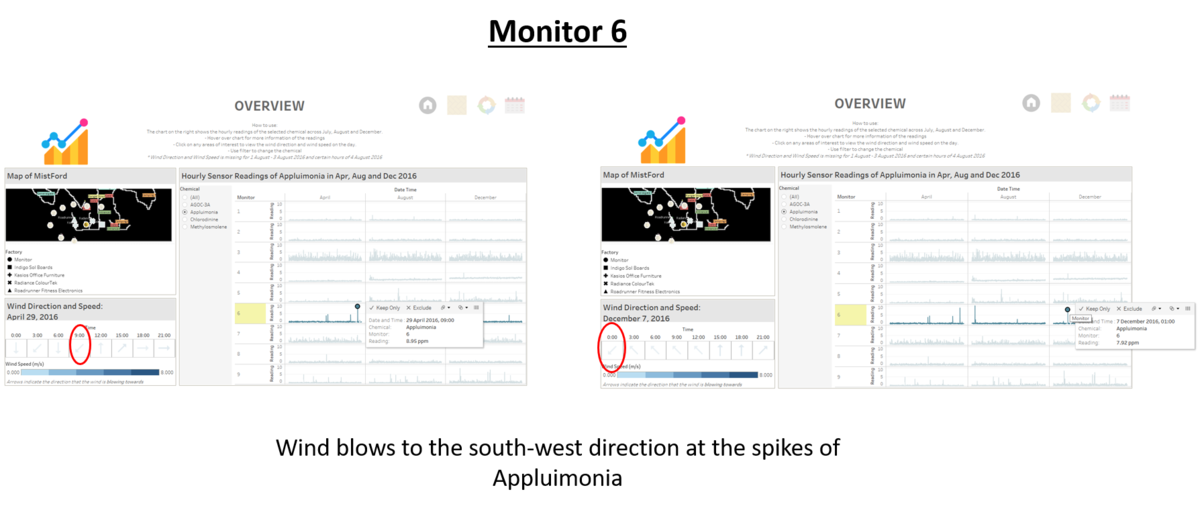
3. On the otherhand, Radiance ColourTek and/or Indigo Sol Boards seem to be responsible for the emission of Appluimonia. Using the same method as the above steps, I have analysed the correlation between the peaks of Appluimonia readings in monitor 6 with the wind direction and speed. It seems that the spikes of Appluimonia readings in monitor 6 tend to occur when the wind is blowing to the west or south-west direction. This tells us that the source is located in the east of monitor 6, which is where Radiance ColourTek and/or Indigo Sol Boards are situated. Thus it is highly likely that Appluimonia is emitted by Radiance ColourTek and/or Indigo Sol Boards.
4. It is surprising to discover that some of the spikes in AGOC-3A also happens when the wind is blowing in the south-west direction. This shows that Radiance ColourTek, which is situated in the north-east of monitor 6, is also responsible for the release of AGOC-3A.
Monitor 9
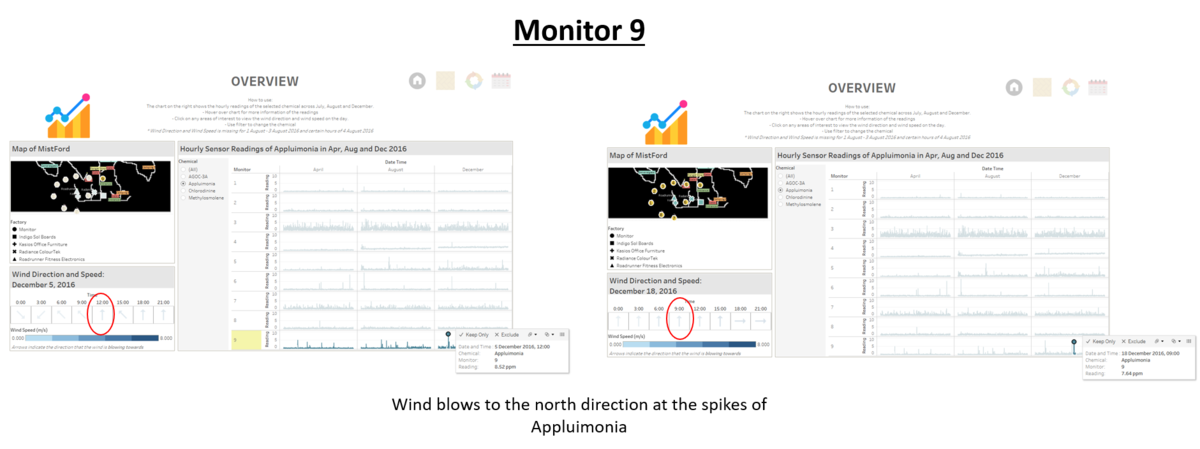
Monitor 9 offers us a clue as to whether Radiance ColourTek and/or Indigo Sol Boards is responsible for the release of Appluimonia. By analysing the spikes, it is discovered that it usually happens when the wind is blowing towards the north direction. Hence, this tells us that Appluimonia is coming from the south where Indigo Solboard is located.
Monitor 3
Looking at the Daily Chart, it seems that Monitor 3 constantly has consistently high fluctuation of Chlorodinine and Appluimonia. Thus, this indicates that the readings are relatively independent of the wind direction, which means that a a source of release is very close to the monitor. Assuming there are only 4 possible suspects, the closest source would be Roadrunner Fitness Electronics.
Hence we can confirm that Roadrunner Fitness Electronics emits Chlorodinine and Appluimonia.
Monitor 1 and 2
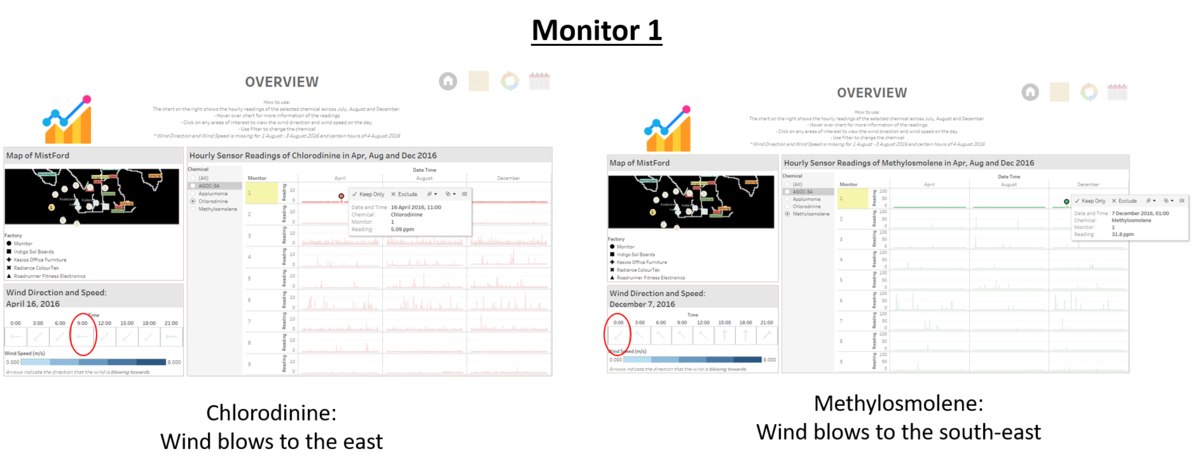
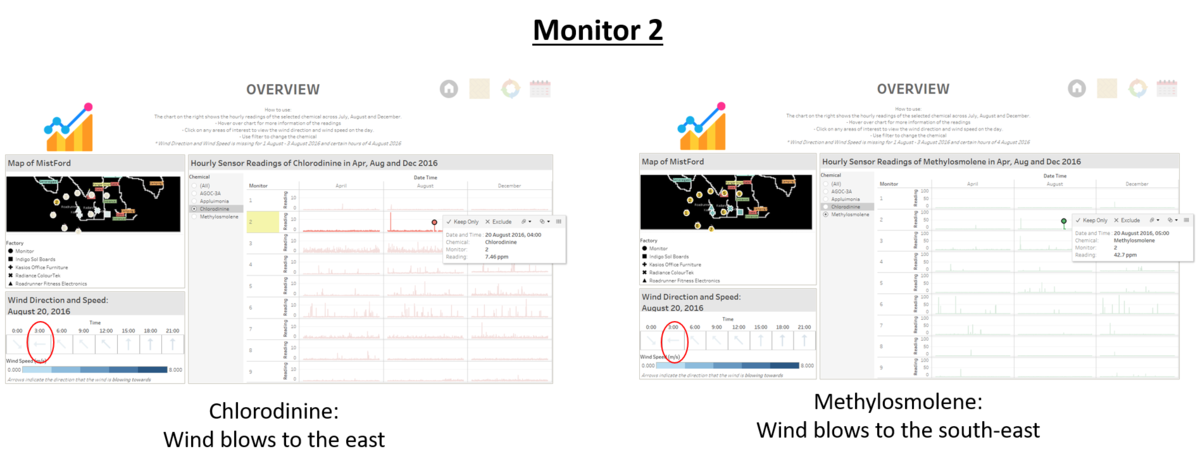
Allows us to identify whether the source is from Roadrunner Fitness Electronics or Kaisos Office Furnitures. Chemicals from Kaisios Office Furniture cannot reach monitor 1 when the wind is blowing in the south-east direction but chemicals from Roadrunner Fitness Electronics can. Similarly, chemicals from Kaisios Office cannot reach monitor 2 when the wind is blowing in the east direction but chemicals from Roadrunner Fitness Electronics can. Hence, by analysing the direction of the wind from spikes of monitor 1 and 2, we can eliminate the source of release.
In monitor 1, the Methylosmolene spike occurs when the wind is blowing in the south-east direction, hence this tells us that the chemical cannot be from Kasios Office Furnitures.
In monitor 2, the Methylosmolene spike occurs when the wind is blowing in the east direction, hence this tells us that the chemical cannot be from Kasios Office Furniture.
Hence, we have a few evidences to show that it is unlikely that Methylosmolene and Chlorodinine is from Kasios Office Furniture. We cannot say conclusively that Kasios Office Furniture is innocent because there are only two spikes in the 3 months and we only have these two spikes to make our inference.
Based on the AGOC-3A readings of monitor 1 and 2, it does not offer us any insight to identify the source of AGOC-3A.
Summary
To summarise the results, the following table shows which factory is responsible for which chemical.
| AGOC-3A | Appluimonia | Chlorodinine | Methylosmolene | |
|---|---|---|---|---|
| Roadrunner Fitness Electronics | ||||
| Kasios Office Furniture | ||||
| Radiance ColourTek | ||||
| Indigo Sol Boards |
Patterns of release:
1. There seems to be an inverse relationship between the release of AGO3-CA and Methylosmolene. AGO3-CA is usually released from 6:00 to 21:00, while Methylosmolene is usually released from 22:00 to 05:00.
2. The release of Chlorodine seems to occur throughout the day.
3. The release of Appluimonia typically occurs from 01:00 to 14:00.
Conclusion
Who is responsible for the fall of Rose-Crested Blue Pits in Mistford?
To determine who is responsible for the fall of Rose-Crested Blue Pits, we could first narrow down the chemicals that might have led to the deaths of the birds and then find out who are the major contributors of those chemicals.
Out of all the 4 chemicals, the more harmful chemicals are Chlorodinine and Methylosmolene, which can attack and destroy exposed body tissues and cause toxic effects in vertebrates respectively. Appluimonia is usually not at levels that could cause damage to living things while AGOC-3A is more environmentally friendly and less harmful to humans. Hence, Chlorodinine and Methylosmolene are most likely the chemicals that resulted in the deaths of the birds. The next step is to determine who are the major contributors of these two chemicals.
As discussed in task 3, the main contributor of Chlorodinine and Methylosmolene are Roadrunner Fitness Electronics and possibly Kasios Office Furniture. It is also discovered that Roadrunner Fitness Electronics/ Kasios Office Furniture is releasing more chemical into the environment overtime. Action needs to be taken to stop them before they cause further damage to the environment.
Credit
Done in collaboration with Peh Jing Yuan
Comments
Appreciate any comments :)
