ISSS608 2016-17 T3 Assign ANGAD SRIVASTAVA Vast Q3
|
|
|
|
|
|
|
|
|
Area of Investigation
Which factories are responsible for which chemical releases? Carefully describe how you determined this using all the data you have available. For the factories you identified, describe any observed patterns of operation revealed in the data. Limit your response to no more than 8 images and 1000 words.
The Investigative Journey
The visual investigation conducted previously includes exploratory analysis of individual sensors and chemical readings. However, an important aspect of this analysis is to eventually trace the high chemical emissions back to its origin.
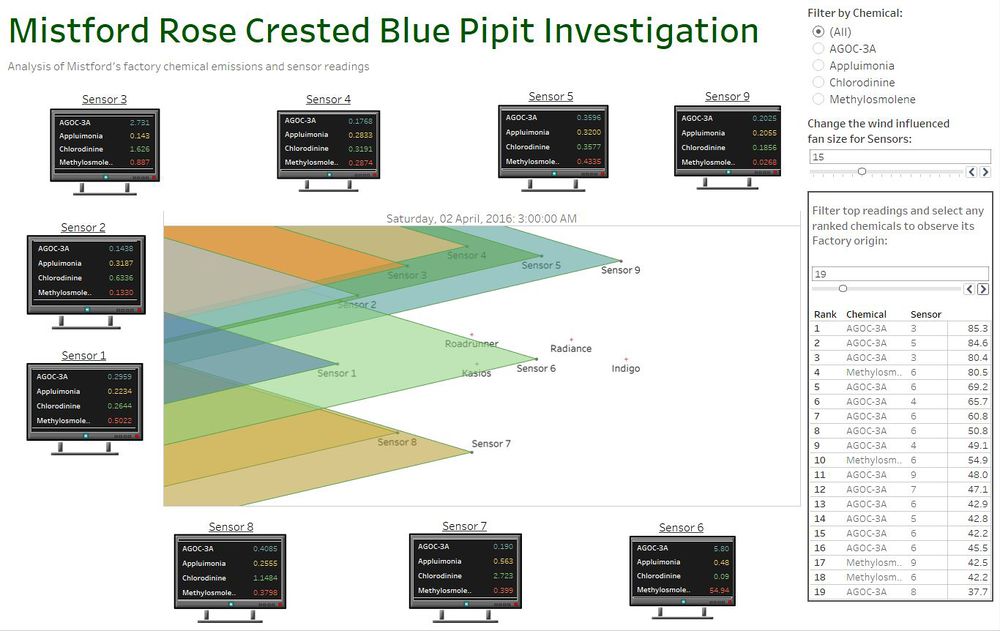
In order to link factories to high chemical readings captured by all 9 sensors, the following dashboard has been prepared.
As shown above, a map of all 9 sensors and 4 factories has been plotted based on their location coordinates. The map shows the influence of wind direction based on the given meteorological data in the form of triangular polygons. The wind influence area for each Sensor has been derived based on the assumption that the fan-size is 15 geographic units in either direction of the wind direction, thereby creating a triangular sector.
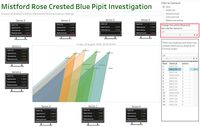
The fan size can be dynamically changed based on the filter shown below:
The map is surrounded by graphical representation of 9 Sensor monitors which detect the readings of all 4 chemicals at each sensor at any given time frame.
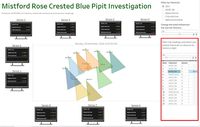
In order to effectively detect and investigate the factory source of high chemical emissions, I have created a ranked table of chemical readings that can drive this dashboard, as shown below:
For ease of use, the dashboard provides a dynamically filter which allows the targeted audience to look at any number of highest captured readings.
Additionally, there is also a filter for choosing any specific chemical in order to visually analyse its source factories in isolation.
Based on the selection of any of these filtered highest chemical readings, we can use this dashboard to carefully predict the source factory of the emissions based on the projected wind direction from all sensors.
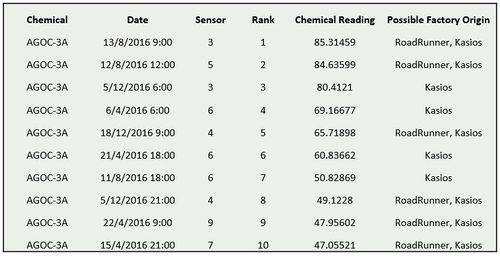
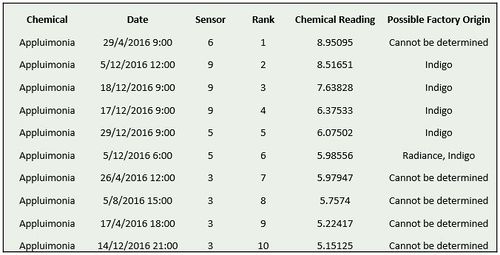
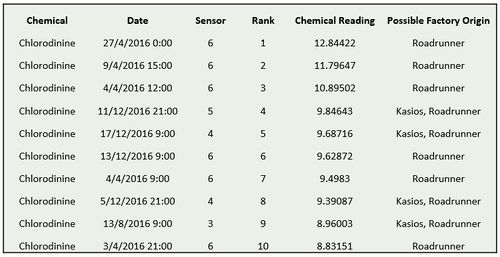
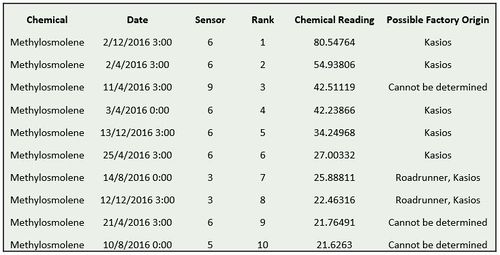
The tables below show the highest recorded chemical readings and its approximate source factories. For the purpose of this analysis, the following tables show the highest 10 readings for each chemical with a possible determination of the origin factory source.

