ISSS608 2016-17 T3 Assign ANGAD SRIVASTAVA Vast
|
|
|
|
|
|
|
|
Area of Investigation
Characterize the sensors’ performance and operation. Are they all working properly at all times? Can you detect any unexpected behaviors of the sensors through analyzing the readings they capture? Limit your response to no more than 9 images and 1000 words.
The Investigative Journey
The available data consists of hourly readings for 9 sensors that detect emissions of 4 distinct chemicals – AGOC-3A, Appluimonia, Chlorodinine and Methylosmolene.
Therefore, accurately consistent readings for each monitor should sum up to:
4 chemicals x 24 readings per day = 96 observations per sensor per day.
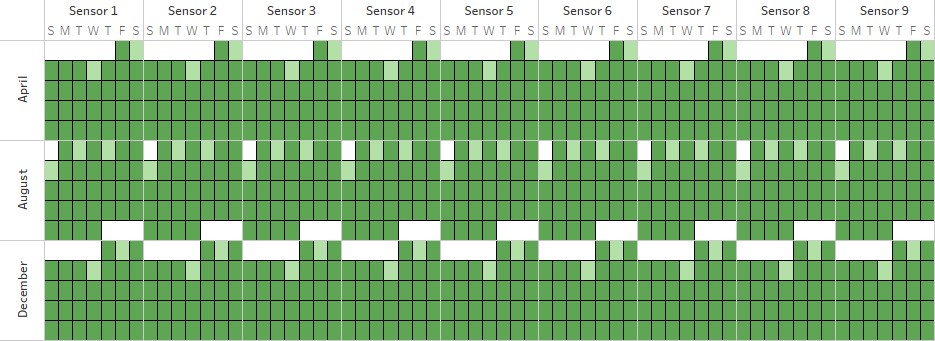
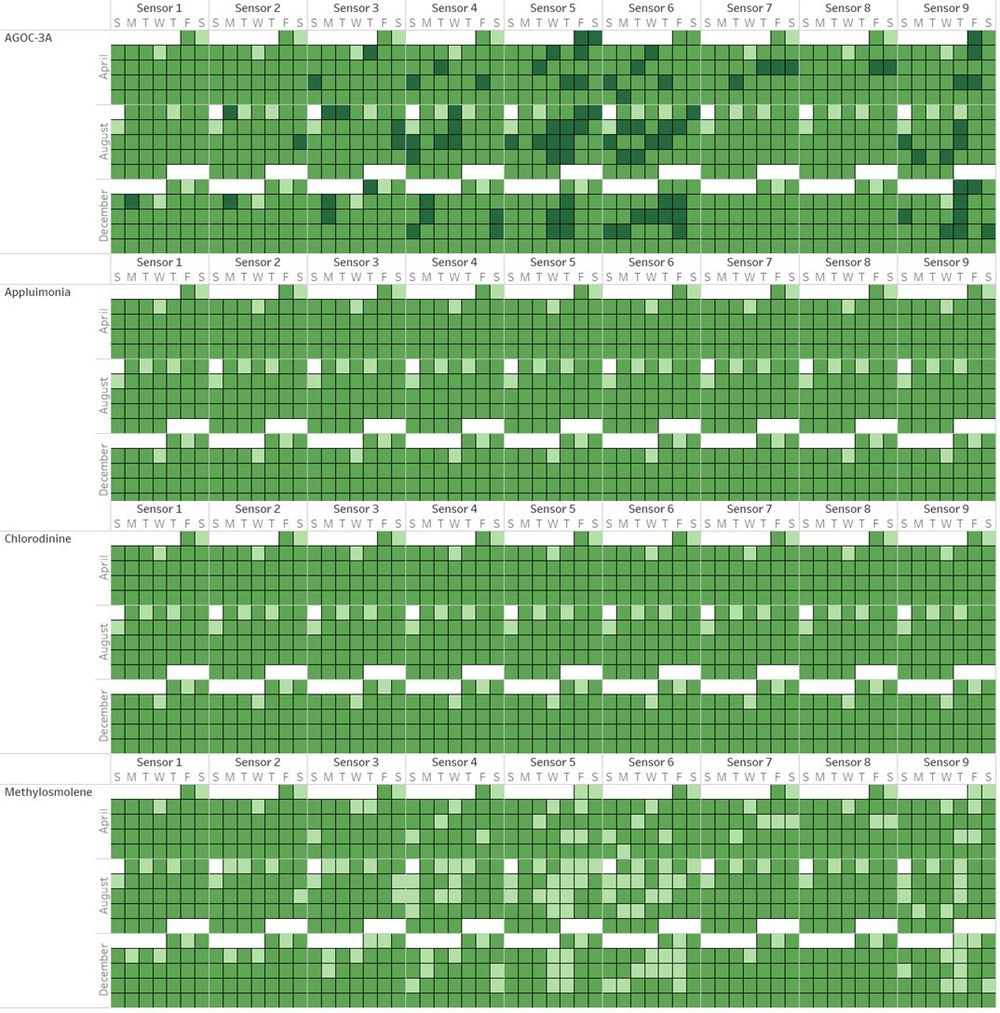
An effective way to characterize the sensor performances is to display the daily readings for all 3 months in a Calendar Heatmap. In the visualization below, the number of readings for each day of the calendar has been stepped coloured into 3 categories: expected number of observations (96 observations per day), lower than expected observations (<96 observations per day) and higher than expected observations (>96 observations per day).
The visualization above shows a common pattern for all 9 available sensors. There are 92 observations for each sensor in the following days of 2016:
- 2nd and 6th April
- 2nd, 4th and 7th August
- 2nd and 7th December.
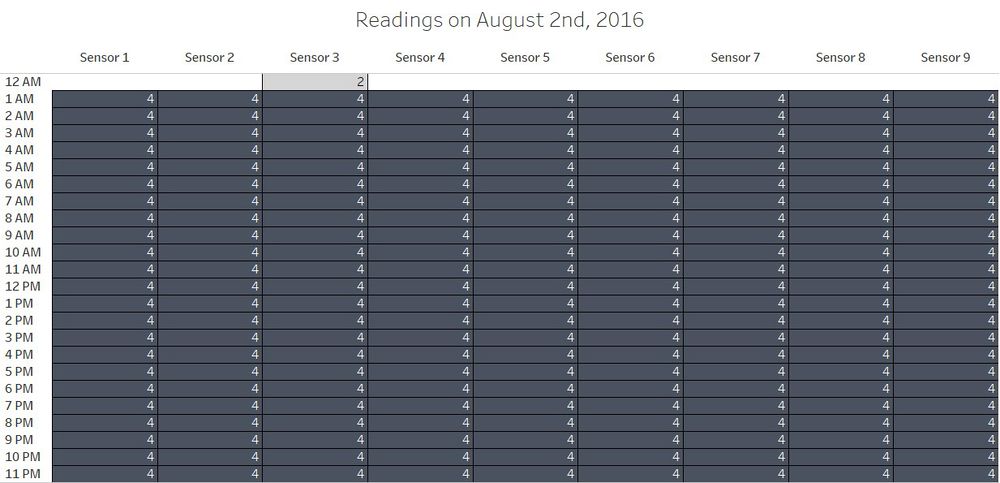
Further investigation into the hourly readings captured on these 7 days when compared to all other days, shows that the reason for capturing lesser observations on these days is due to absence of records at 12am.
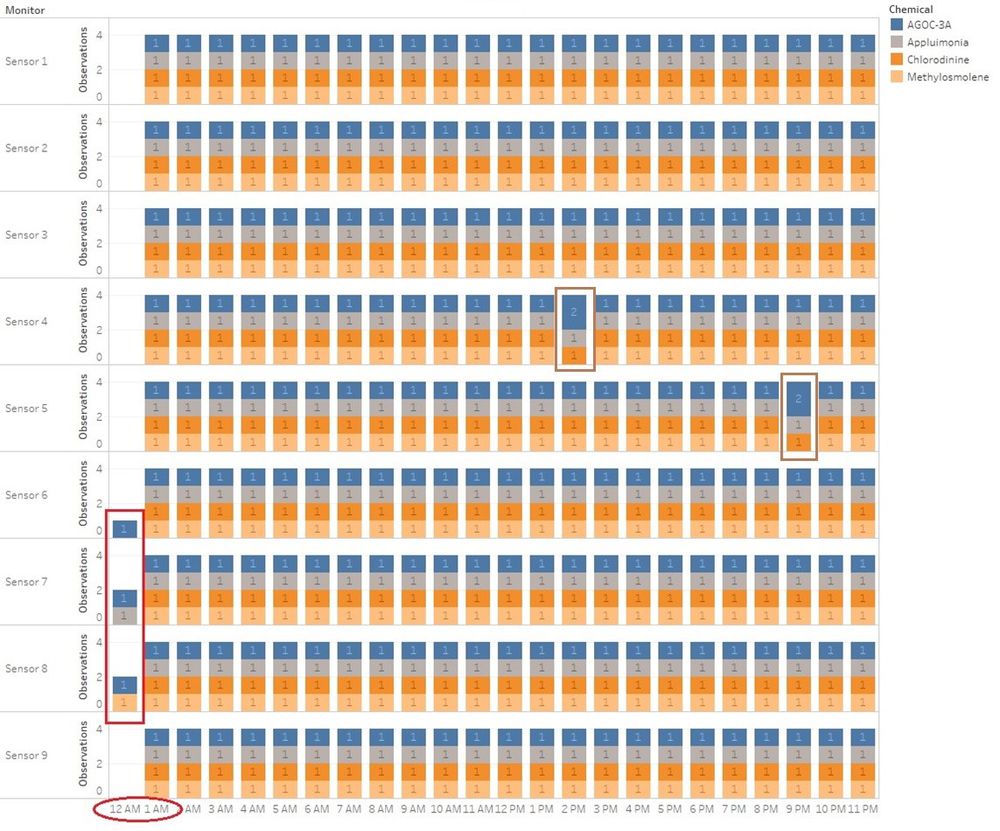
- On 5 out of these 7 days, the sensors were unable to capture any chemical reading at 12am. The timeline of sensor readings, as shown above for April 2nd, 2016; begins from 1am till 11pm highlighting the absence of any observations at midnight (marked in red). This pattern holds true for 5 of the 7 identified days:
- April 2nd ,2016
- April 6th ,2016
- August 4th ,2016
- August 7th ,2016
- December 2nd,2016.
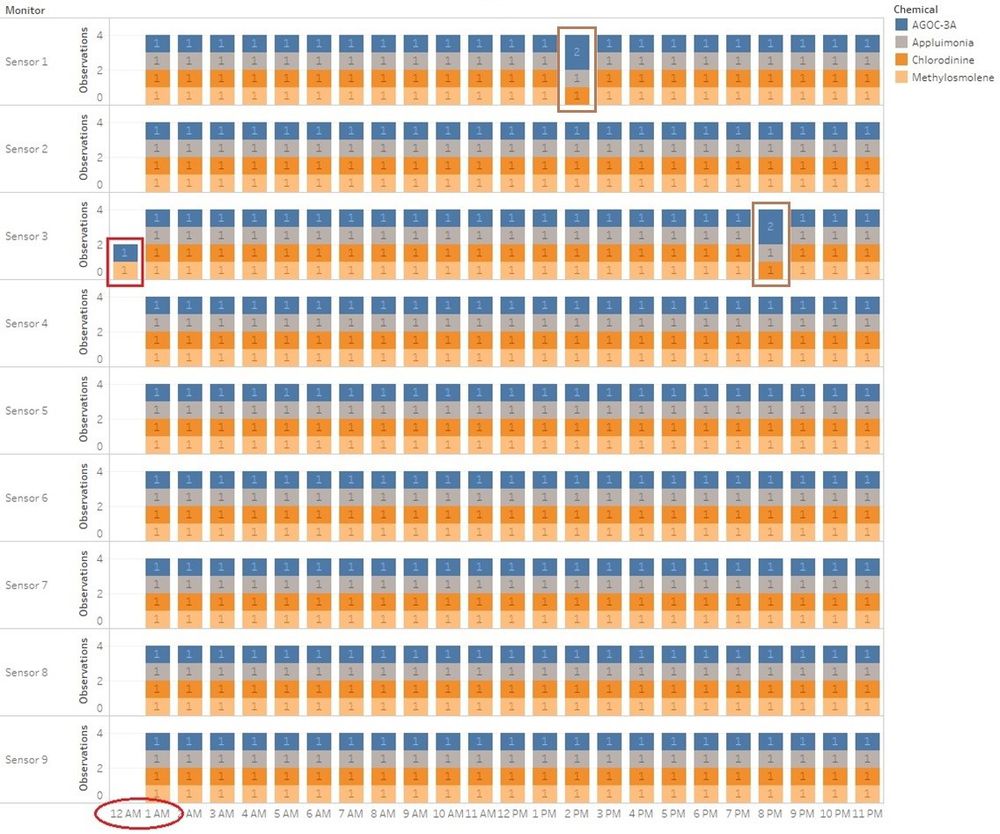
- On August 2nd, 2016; Sensor 3 captured some chemical readings namely for AGOC-3A and Methylosmolene, as shown by the Calendar chart and stacked bar-chart below (marked in Red).
The differentiation of chemicals observed in the stacked bar-chart also shows anomalies in chemical readings with multiple observations for AGOC-3A and no observations for Methylosmolene (marked in Brown). These anomalies will be investigated later.
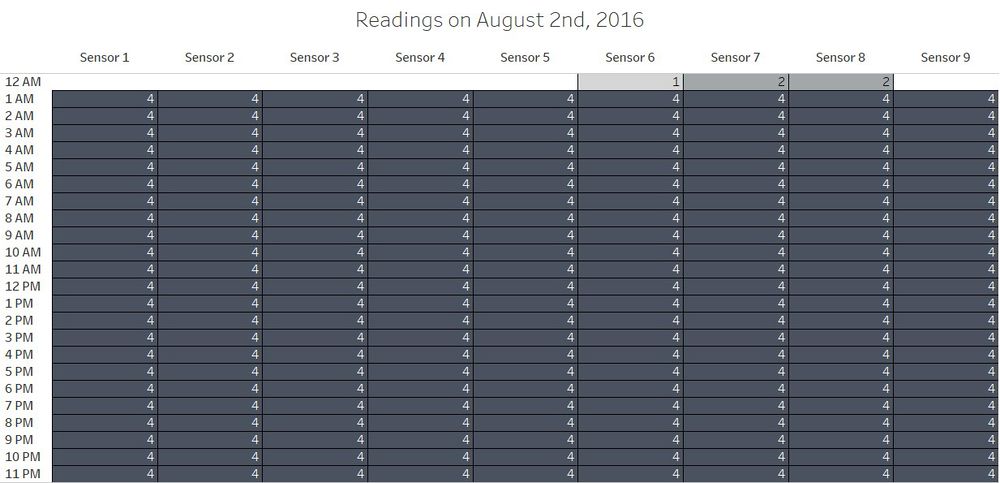
- On December 7th, 2016; sensors 6, 7 and 8 captured traces of AGOC-3A, Appluimonia and Methylosmolene as shown by the Calendar chart and stacked bar-chart below (marked in Red and Brown).
As mentioned above, a noteworthy observation from Figure 5 and Figure 6 shows that it is not necessary that for days with expected number of total observations (96) are equally distributed with 24 readings for each chemical per day per monitor.
Investigations summarized above only consider days that had lesser than expected total daily observations with 92 readings per day.
In an ideal scenario, each sensor should observe 1 reading per chemical for every hour. An effective way to visualize such patterns is to once again use the Calendar chart for each chemical with 3 stepped colours to look at the consistency of the observations for each chemical.
For chemicals – Chlorodinine and Appluimonia, the pattern of recorded observations is the same as the expected result with 24 recorded readings for each of these chemical at every sensor. The only exceptions to these consistent readings are the previously identified 7 days that have low total observations due to the absence of observations at 12am.
However, for chemicals – Methylosmolene and AGOC-3A; there is a high inconsistency within observations. While there is no generalized pattern across sensors to explain these erratic readings, it is interesting to note that for all instances of decreased number of observations for Methylosmolene there is an exact corresponding high number of observations for AGOC-3A on the same day.
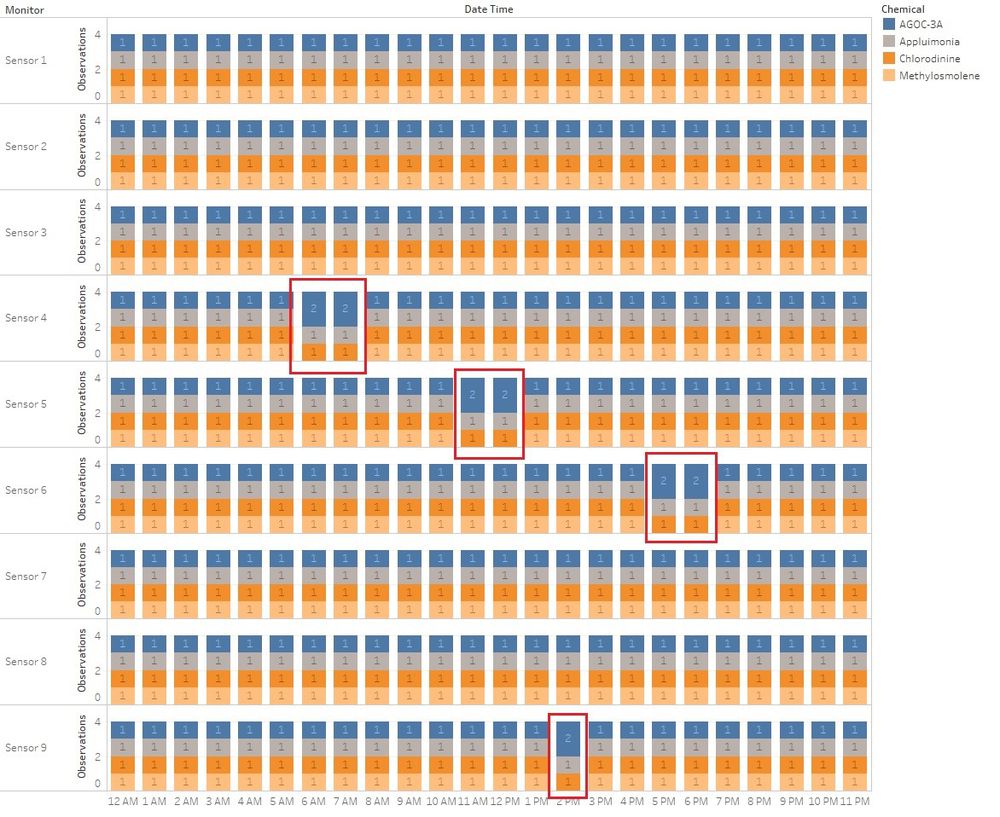
Further investigation into these highlighted days shows that sensors tend to have double readings for AGOC-3A for some hours and no corresponding readings for Methylosmolene in the same time-frame. A good example to show this behaviour is based on the readings observed on August 14th, 2016; where readings from Sensors 4, 5, 6 and 9 contain multiple instances where there are 2 observations for AGOC-3A and none for Methylosmolene.
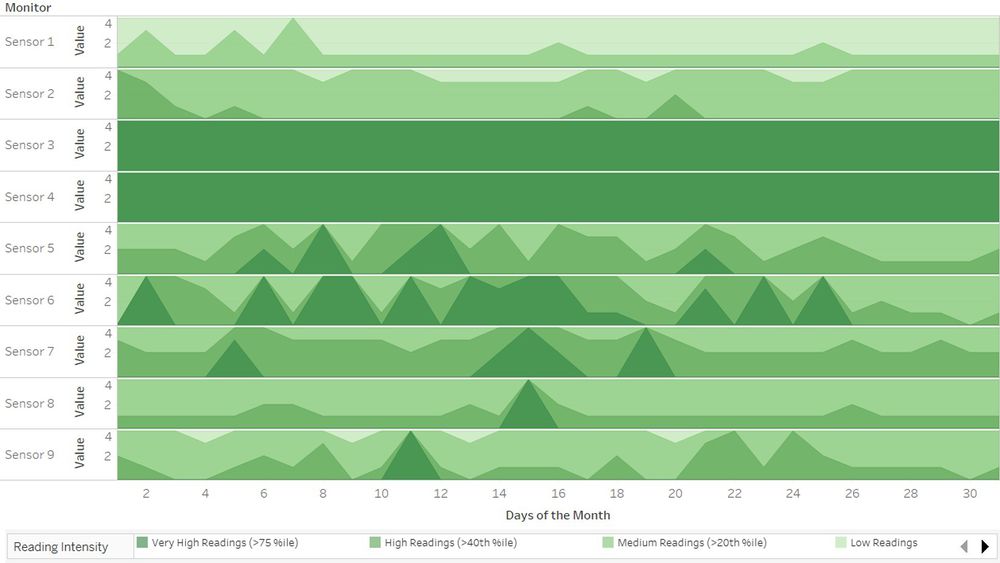
Lastly, a look into the readings captured by each sensor also reveals the degree of influence each sensor has when it comes to capturing the chemical emissions. A unique way to show the degree of intensity of readings captured by each sensor has been captured by the utilization of a Horizon Chart. The screenshot below shows the chemical readings captured by each sensor, where the readings have been broadly classified into 4 groups:
As shown above, sensor 3 and sensor 4 tends to capture the highest readings. Moreover, sensor 6, sensor 5 and sensor 7 are also moderately responsible for detecting high chemical readings within the given time period. Sensor 1 seems to capture low readings of chemical.
Further investigation into the chemicals and the corresponding factories that might be emitting high emissions of these chemicals will be conducted in subsequent sections.

