ISSS608 2016-17 T3 Assign ZHANG YANRONG Visualization
 VAST Challenge 2017 MC3
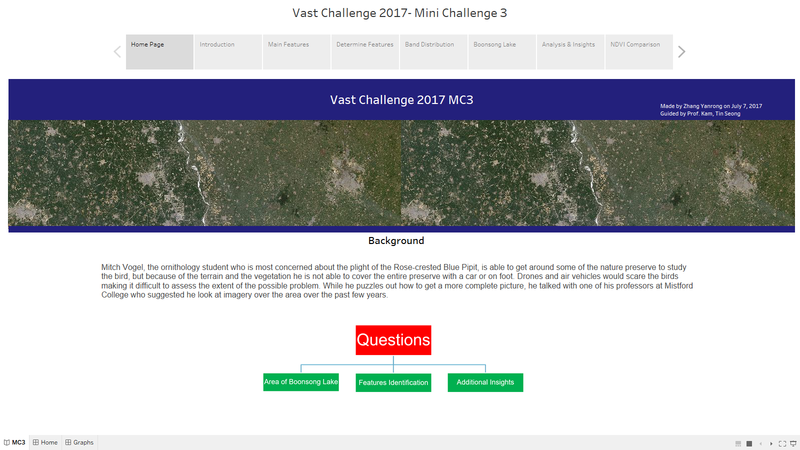
|
|
|
|
|
|
|
Please view Visualization for MC3 on Tableau Public
Contents
Background Knowledge
Spectral Bands

Derived Measurement

Visualization Tool
Tableau
![]()
Graphs
Choropleth Graph
- A choropleth chart is a thematic chart in which areas are shaded or patterned in proportion to the measurement of the statistical variable being displayed on the graph.
- Since we have many measurements such as NDVI, NDWI, NDMI, BSI and AVI, we use Choropleth to represent these measurements on the graph.
- In order to relate each measurement with its actual meaning, we select appropriate color to show on the Graph.
- For example, NDVI represent the health of plants so we choose to use Divergence of Orange and Green.
- Blue for Water, brown for soil, so on and so forth.

Line Graph
- Each of the lines in the line graph shown below represent the factor making up the relevant measurement and their average value by month.
- In this case, we choose NDVI as measurement and the formula of NDVI is (B4-B3)/(B4+B3). Therefore the two factors of NDVI are B4 and B3.
- From the graph, we can see that there is little difference between B4 and B3 on February, March, November and December.
- In order to get a clear and obvious outcome, we need to analyze data on other months which differentiate the factors.

Area Graph

Histogram

Dashboard
Home Page

Introduction

Main Features

Determine Features

Band Distribution

Boonsong Lake

Analysis&Insights

NDVI Comparison

Interactive Techniques
| Name | User Interface | Description |
|---|---|---|
 |
Blank | |
  |
Blank | |
 |
Blank | |
   |
Blank | |
 |
Blank | |
 |
Blank |
Story

QGIS

Image Processing


