Difference between revisions of "ISSS608 2016-17 T3 Assign ZHANG YANRONG Visualization"
Jump to navigation
Jump to search
Yrzhang.2016 (talk | contribs) |
Yrzhang.2016 (talk | contribs) |
||
| Line 52: | Line 52: | ||
[[file:Tableau_YR.png|200px]] | [[file:Tableau_YR.png|200px]] | ||
| − | === | + | ===Graphs=== |
| − | ====Choropleth | + | ====Choropleth Graph==== |
| + | *A choropleth chart is a thematic chart in which areas are shaded or patterned in proportion to the measurement of the statistical variable being displayed on the graph. | ||
| + | |||
| + | *Since we have many measurements such as NDVI, NDWI, NDMI, BSI and AVI, we use Choropleth to represent these measurements on the graph. | ||
| + | |||
| + | *In order to relate each measurement with its actual meaning, we select appropriate color to show on the Graph. | ||
| + | |||
| + | *For example, NDVI represent the health of plants so we choose to use Divergence of Orange and Green. | ||
| + | |||
| + | *Blue for Water, brown for soil, so on and so forth. | ||
[[file:Choropleth_YR.png|800px]] | [[file:Choropleth_YR.png|800px]] | ||
| − | ====Line | + | ====Line Graph==== |
[[file:Lines_YR.png|800px]] | [[file:Lines_YR.png|800px]] | ||
| − | ====Area | + | ====Area Graph==== |
[[file:Areas_YR.png|800px]] | [[file:Areas_YR.png|800px]] | ||
Revision as of 19:25, 12 July 2017
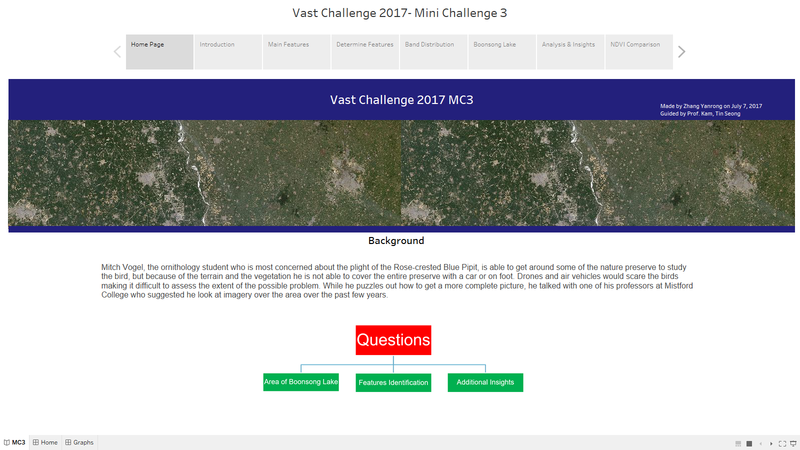
 VAST Challenge 2017 MC3
|
|
|
|
|
|
|
Please view Visualization for MC3 on Tableau Public
Contents
Background Knowledge
Spectral Bands

Derived Measurement

Visualization Tool
Tableau
![]()
Graphs
Choropleth Graph
- A choropleth chart is a thematic chart in which areas are shaded or patterned in proportion to the measurement of the statistical variable being displayed on the graph.
- Since we have many measurements such as NDVI, NDWI, NDMI, BSI and AVI, we use Choropleth to represent these measurements on the graph.
- In order to relate each measurement with its actual meaning, we select appropriate color to show on the Graph.
- For example, NDVI represent the health of plants so we choose to use Divergence of Orange and Green.
- Blue for Water, brown for soil, so on and so forth.

Line Graph

Area Graph

Histogram

Dashboard
Home Page

Introduction

Main Features

Determine Features

Band Distribution

Boonsong Lake

Analysis&Insights

NDVI Comparison

Interactive Techniques
| Name | User Interface | Description |
|---|---|---|
 |
Blank | |
  |
Blank | |
 |
Blank | |
   |
Blank | |
 |
Blank | |
 |
Blank |
Story

QGIS

Image Processing


