Difference between revisions of "Assign NGO SIEW HUI Q1"
| Line 36: | Line 36: | ||
==Response== | ==Response== | ||
| − | As the sensors | + | As the sensors were supposed to be taking readings at every hour of the day, we would like to know if there are any missing records. Hence, a dashboard was developed with interactive filters (i.e. select sensor, month and chemical) to enable the viewing of captured readings on an hourly basis. |
<br/> <br/> | <br/> <br/> | ||
[[Image:ngo_fig1.png|800px|center]] | [[Image:ngo_fig1.png|800px|center]] | ||
<br/> <br/> | <br/> <br/> | ||
| − | '''Observation 1''': There | + | '''Observation 1''': There were indeed many missing records spread across all months, sensors and chemicals. |
<br/> <br/> | <br/> <br/> | ||
| Line 47: | Line 47: | ||
[[Image:ngo_fig2.png|800px|center]] | [[Image:ngo_fig2.png|800px|center]] | ||
<br/> <br/> | <br/> <br/> | ||
| − | '''Observation 2''': The number of missing records for Methylosmolene | + | '''Observation 2''': The number of missing records for Methylosmolene matched the number of additional (extra) records for AGOC-3A, and hence a <u>mirror image</u> was observed in the chart. This might be due to a system bug which had wrongly recorded the readings for Methylosmolene against AGOC-3A instead. |
| + | <br/> <br/> | ||
| + | We used the above dashboard to view the no. of extra / missing records for the other two chemicals, Appluimonia and Chlorodinine. | ||
| + | <br/> <br/> | ||
| + | [[Image:ngo_fig3.png|800px|center]] | ||
| + | <br/> <br/> | ||
| + | '''Observation 3''': There were missing records for Appluimonia and Chlorodinine which had occurred during the same days within each month. For example, missing records were observed on the 2nd and 6th day of April across all 9 sensors. This might be due to a system bug or it could be some system maintenance process which led to all sensors not being able to capture readings during those days. | ||
<br/> <br/> | <br/> <br/> | ||
Revision as of 01:20, 8 July 2017
|
|
|
|
|
|
|
Question 1
Characterize the sensors' performance and operation. Are they all working properly at all times? Can you detect any unexpected behaviors of the sensors through analyzing the readings they capture? Limit your response to no more than 9 images and 1000 words.
Response
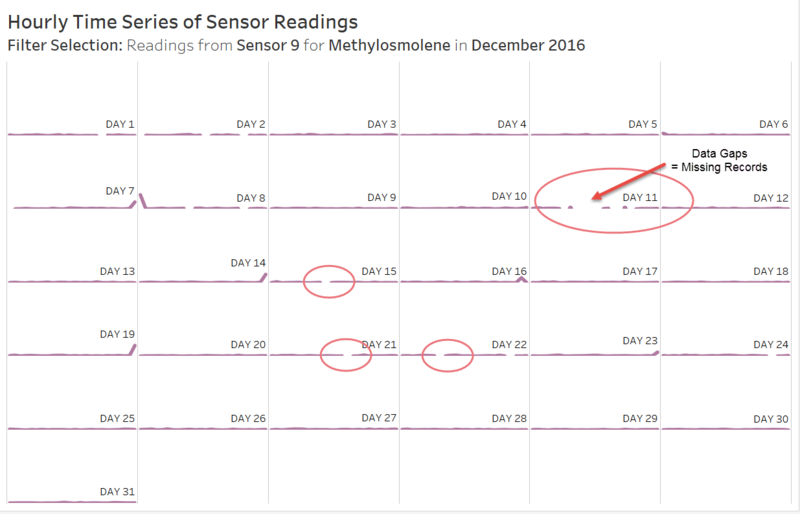
As the sensors were supposed to be taking readings at every hour of the day, we would like to know if there are any missing records. Hence, a dashboard was developed with interactive filters (i.e. select sensor, month and chemical) to enable the viewing of captured readings on an hourly basis.
Observation 1: There were indeed many missing records spread across all months, sensors and chemicals.
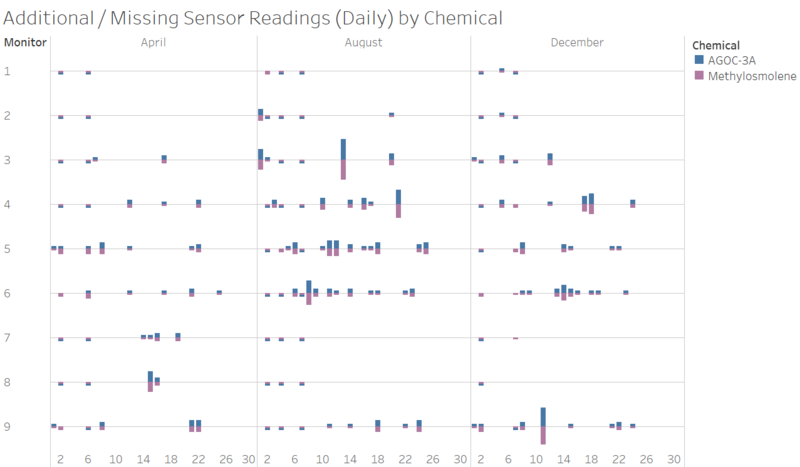
Next, a dashboard was developed to view the number of missing records, on the basis that we would expect 24 readings in one day for a specified chemical and sensor. Interactive filters were added to enable selection of chemical(s). In the process, it was observed that there were additional (extra) records present in the data, i.e. more than one single record for a particular sensor, chemical and hour of the day.
Observation 2: The number of missing records for Methylosmolene matched the number of additional (extra) records for AGOC-3A, and hence a mirror image was observed in the chart. This might be due to a system bug which had wrongly recorded the readings for Methylosmolene against AGOC-3A instead.
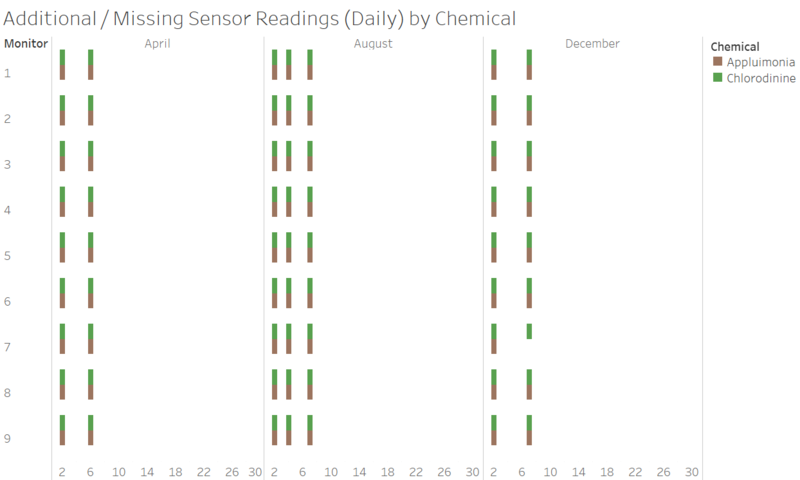
We used the above dashboard to view the no. of extra / missing records for the other two chemicals, Appluimonia and Chlorodinine.
Observation 3: There were missing records for Appluimonia and Chlorodinine which had occurred during the same days within each month. For example, missing records were observed on the 2nd and 6th day of April across all 9 sensors. This might be due to a system bug or it could be some system maintenance process which led to all sensors not being able to capture readings during those days.


