Assign NGO SIEW HUI Q1
|
|
|
|
|
|
|
Question 1
Characterize the sensors' performance and operation. Are they all working properly at all times? Can you detect any unexpected behaviors of the sensors through analyzing the readings they capture? Limit your response to no more than 9 images and 1000 words.
Response
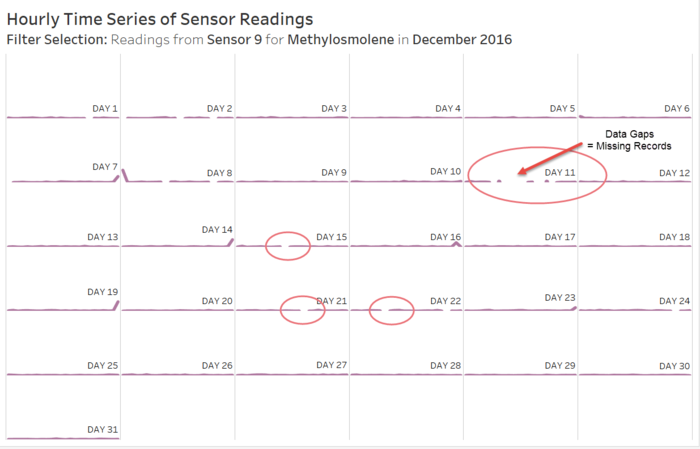
As the sensors are supposed to be taking readings at every hour of the day, it would be interesting to find out if there are any missing records. Hence, a dashboard is created with interactive filters (i.e. select sensor, month and chemical) to enable the viewing of captured readings on an hourly basis. The visualisation is in the form of a trellis chart to facilitate a single view of the selected month, with each day of the month represented by each panel.
Note that this chart is designed to provide a quick overview of the data gaps (if any), and it is not meant for analysing the sensor readings (refer to Question 2 for analysis of the readings). Hence, the scale of the y-axis for the sensor readings has been adjusted accordingly, i.e. the plotted lines are 'flatten' in order to spot the missing records easily.
Sample View of Dashboard: Hourly Time Series of Sensor Readings
Observation 1: There are indeed many missing records spread across all 3 months of data (April, August and December), and also across all 9 sensors and 4 chemicals. For example, from the above image, it is clear that quite a few readings are missing from Sensor 9 for chemical Methylosmolene on 11 December 2016.
After establishing that there are missing records from the Sensor Data, the next step would be to analyse the number of records captured per day (break-down by sensors and chemicals). Hence, a dashboard is created to view the deviations from the expected number of records, on the basis that there should be 24 readings expected per day for the selected chemical and sensor. To obtain the deviation from the expected number of records, a new calculated field is used (i.e. 'count of records' minus 24). Note that interactive filters are added to the dashboard so as to enable the selection of a single / multiple chemical(s).
Note: If the number of records is as expected (i.e. 24), the value of deviation would be zero, and hence it would not show up on the chart (i.e. ideal scenario). The zero-axis is used as a reference line to view the negative deviations (i.e. missing records) and the positive deviations (i.e. extra records).
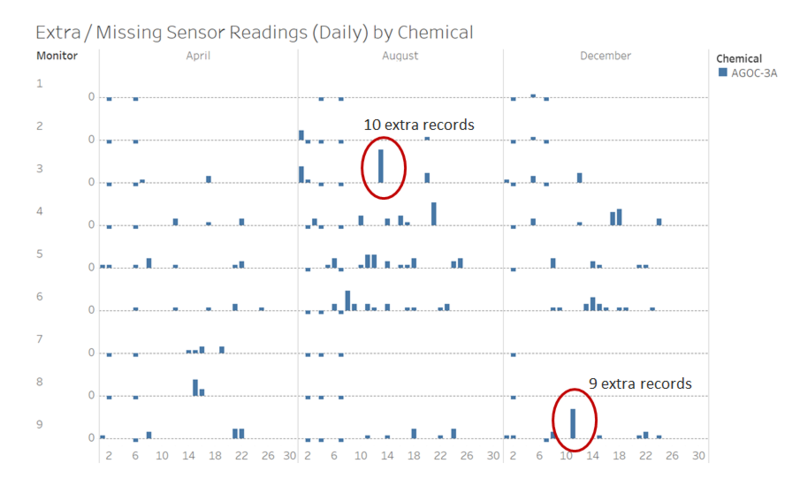
Sample View of Dashboard: Extra / Missing Sensor Readings by Chemical (Daily View)
Observation 2: Aside from the missing records, it is clear from the dashboard that there are extra records present in the data for chemical AGOC-3A, as evident by the number of records captured per day being greater than 24 for each sensor (i.e. positive deviations, above the zero-axis line). From the above image, it is noted that the extra records are spread across the sensors and days, but there are 2 days (i.e. 13 August and 11 December) with particularly high number of extra records (i.e. 10 and 9 extra records respectively).
Note: This also highlights the undesirable situation that there are more than one single record for a particular sensor, chemical and hour of the day. Hence, considerations should be made during downstream analysis (e.g. avoid double-counting of sensor readings which would skew the analysis).
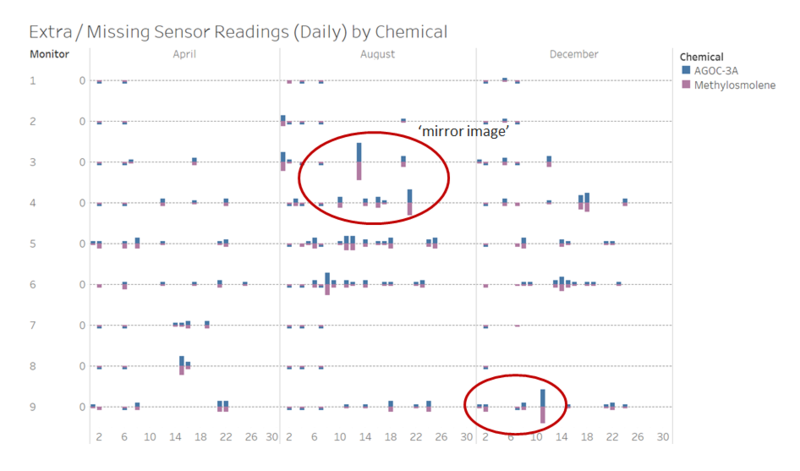
Sample View of Dashboard: Extra / Missing Sensor Readings by Chemical (Daily View)
Observation 3: When both chemicals, AGOC-3A and Methylosmolene, are selected on the dashboard, it is observed that the number of missing records for Methylosmolene matches the number of extra records for AGOC-3A, and hence a mirror image is observed in the chart. This might be due to a system bug which had wrongly recorded the readings for Methylosmolene against AGOC-3A instead.
Note: This would impact the downstream analysis of sensor readings for both chemicals, AGOC-3A and Methylosmolene. Hence, it is recommended that further checks should be conducted by the operations team supporting sensors' operations to investigate if this discrepancy in sensor readings is due to any system bug or malfunction of sensor.
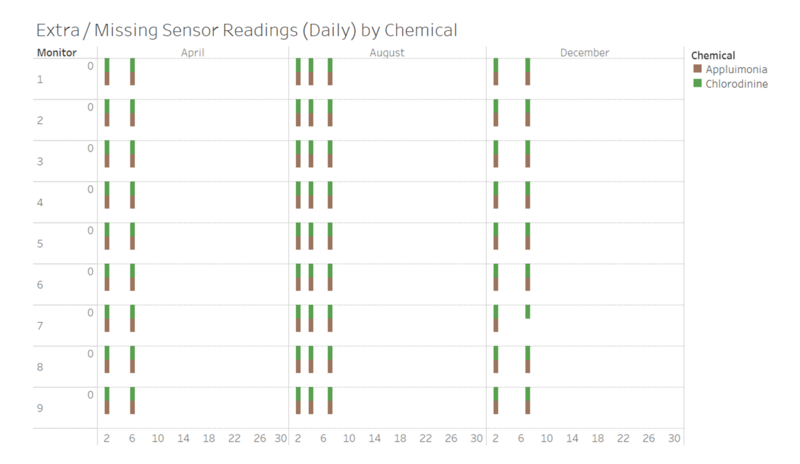
Sample View of Dashboard: Extra / Missing Sensor Readings by Chemical (Daily View)
Observation 4: When both chemicals, Appluimonia and Chlorodinine, are selected on the dashboard, it is observed that the missing records for Appluimonia and Chlorodinine have mostly occurred on the same days. To elaborate, there are missing records for both chemicals across all 9 sensors on the following 7 days (i.e. across the 3 months' of data provided):
- 02 April and 06 April;
- 02 August, 04 August and 07 August;
- 02 December and 07 December.
Further analysis on the dashboard (i.e. selecting all 4 chemicals) reveals that on these 7 days, all 4 chemicals have missing records consistently. This might be due to a system bug or it could be some system maintenance process (e.g. rebooting of the sensors' application) which has led to all 9 sensors having missing records for all 4 chemicals during those days.
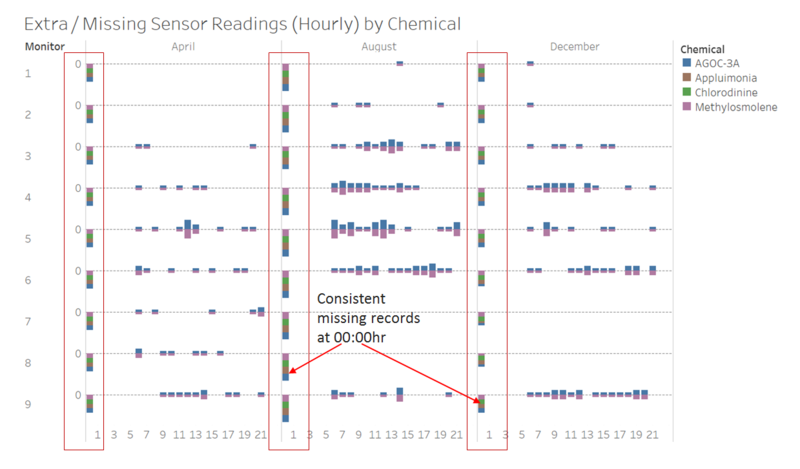
Based on the above observation, it would be interesting to find out if the missing records have occurred during the same timing. Hence, a different dashboard with a similar view as above was created based on the number of records at the hourly basis. In this case, however, there should be 30 or 31 readings expected per month for the selected chemical and sensor at the hourly basis (e.g. there should be 30 records at 00:00hr and every subsequent hour for each chemical during the month of April). To obtain the deviation from the expected number of records, a new calculated field is used (i.e. 'count of records' minus 30/31 depending on which month). Similarly, interactive filters are added to the dashboard so as to enable the selection of a single / multiple chemical(s).
Sample View of Dashboard: Extra / Missing Sensor Readings by Chemical (Hourly View)
Observation 5: From the dashboard, it is clear that there are many missing records which have occurred during midnight (00:00hr) consistently across all sensors and for all 4 chemicals. This would be in line with the above hypothesis, i.e. the missing records are likely due to some system maintenance process (e.g. rebooting of the sensors' application) which has led to all 9 sensors not being able to capture any readings during the specific hour designated for system shut-down / reboot.
To access the interactive version of the above dashboards, please go to the following URL on Tableau Public:
https://public.tableau.com/profile/siew.hui.ngo#!/vizhome/VAST_MC2_Assignment_Report/VASTMC2

