Assign NGO SIEW HUI Data
|
|
|
|
|
|
|
Contents
Datasets Provided
The datasets consist of sensor readings from a set of air-sampling sensors and meteorological data from a weather station in proximity to the factories and sensors.
Location Data
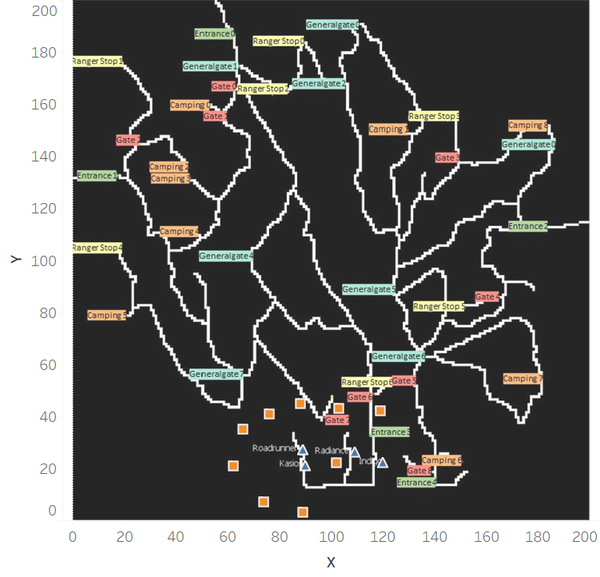
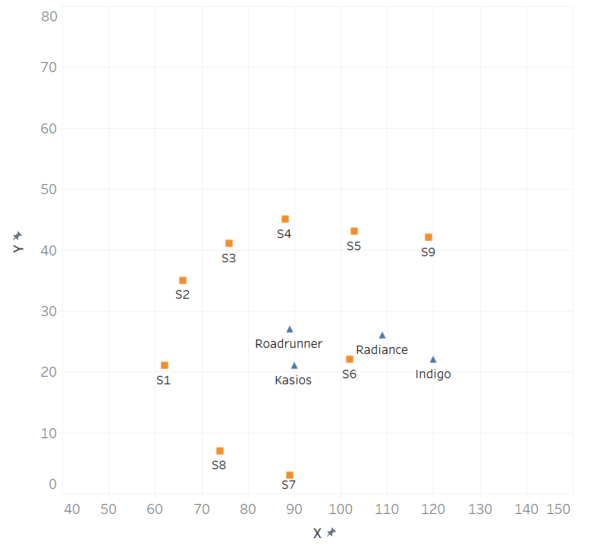
The factories and sensors locations are provided in terms of x,y coordinates on a 200x200 grid, with (0,0) at the lower left hand corner (southwest). The sensors map shows the locations of the sensors and factories by number for the sensors and by name for the factories. Some of the other features of the map (such as entrances and gates in that area) have been removed for readability.
Sensor Data
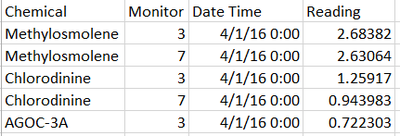
When Mistford began growing its manufacturing industry, both the town and the companies wished to ensure an environmentally sound and economically supportive partnership. With these aims in mind, air sampling sensors have been placed near the town and in the Preserve to monitor air quality. These sensors collect information on several substances of potential concern, including: Appluimonia, Chlorodinine, Methylosmolene and AGOC-3A.
The sensor data contains 3 months of readings (i.e. April, August and December) in the following format:

- Chemical: Which one of the four chemicals detected by the sensors.
- Monitor: Which one of the nine sensors picking up the reading.
- Reading: The air sensor detected amount in parts per million.
- Date Time: The date and time of the reading, local time with no change for Daylight Savings.
Note: From the dataset, it is observed that the sensor readings are being taken at one-hour interval.
Meteorological Data
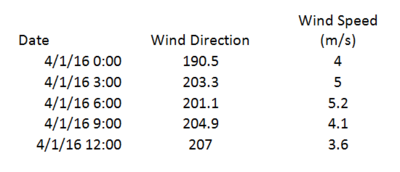
The meteorological data contains 3 months of readings (i.e. April, August and December) in the following format:

- Date: The date and time of the readings, local time with no change for Daylight Savings.
- Wind Direction: The compass directions where the wind is originating from, using a north-referenced azimuth bearing where 360/000 is true north.
- Wind Speed: The speed of the wind in meters per second.
Note: From the dataset, it is observed that the meteorological readings are being taken at three-hour interval.
Data Preparation
For meteorological data, the readings for Wind Direction have been rounded up to the nearest 10 degrees.
To calculate the length of wind sticks (refer to Question 3), which is a form of vector representation of the wind records, the following formulas are applied to calculate the readings on scaled axes (Y and X):
- Y = COSINE(RADIANS([WIND DIRECTION]))*[WIND SPEED])
- X = SINE(RADIANS([WIND DIRECTION]))*([WIND SPEED]+X))
Reference: https://community.tableau.com/thread/177425


