ISSS608 2016-17 T3 Assign JOSEF CARLO CUEVAS EXCONDE WIND
ISSS608 Visual Analytics and Applications
|
|
|
|
|
TO WHERE THE WIND BLOWS AND WHEN
The first question under this mini challenge look at the performance of the sensors, to this we look at the sensor reading and the meteorological data to see the wind direction and wind speed then compares it to the reading of each chemical per sensor both in scale and in proportion.
In this analysis we aim to understand the effectiveness and accuracy of the sensors by comparing the readings per chemical to the sensors in its proximity
Tableau Public Link : https://public.tableau.com/profile/josef.carlo.cuevas.exconde#!/vizhome/SensorReadingsv3/Dashboard1
Data Preparation
For this we would need to load the sensor reading and the meteorological data, making a full outer join between them.
It is important to note the Sensor Reading is done on an hourly basis while the Meteorological Data is done every 3 hours thus there would be sensor reading without any corresponding wind data.
Wind Data
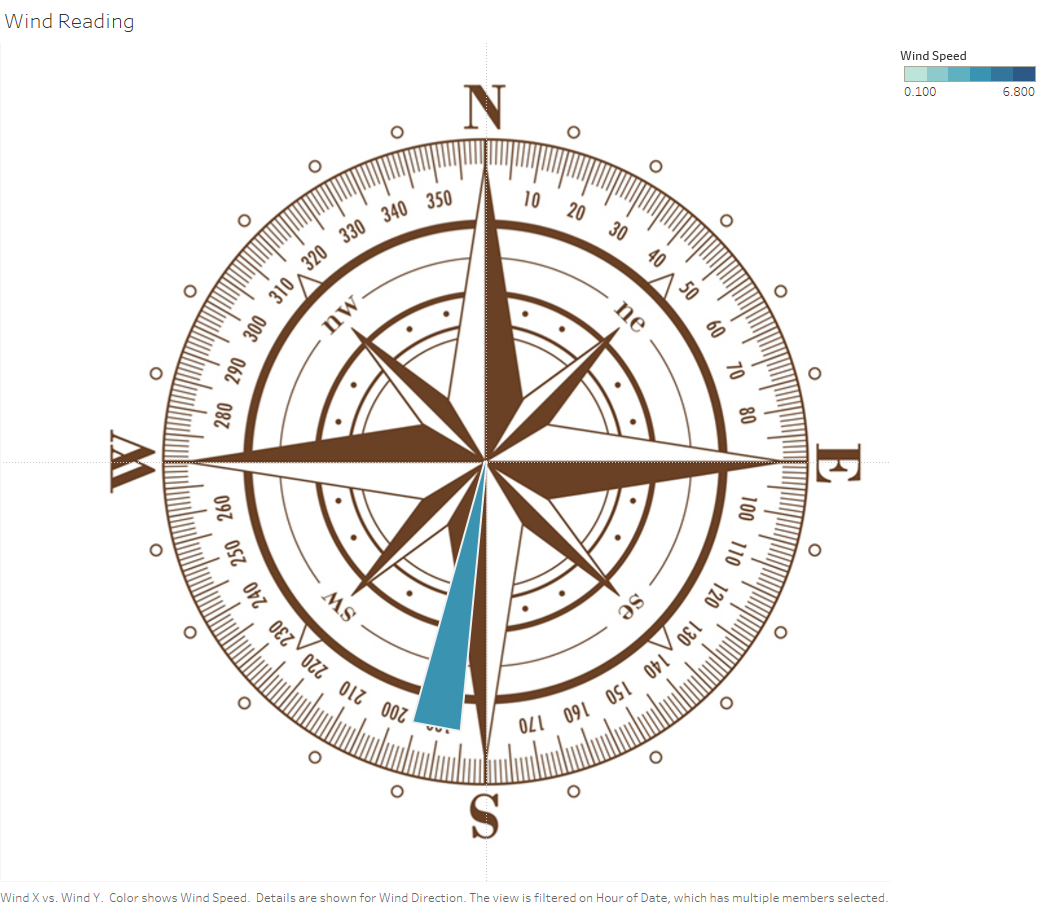
To make sense of the meteorological data we should be able its direction and value in a scale, for this we would be using the coordinate plane to use this we would have to prepare the data that it would be able to portray a shape showing the value and direction of the wind per point in time.
To do this we would need to:
- Add new columns to the data, name them as Point, Length, and Angle
- Make triplicate copies of the wind reading to use as reference points for our polygon, in this case a triangle.
- Label each of the triplicate copies with 1, 2, and 3 in the Point Column, for the purpose of our viz we would refer to Point 1 as the one in the middle, more like a centroid, and points 2 and 3 as the ones in the outer representation of the wind direction.
- For the Angle Column do the following computation:
- Point 1 = 0
- Point 2 = Wind Direction - 5
- Point 3 = Wind Direction + 5
This would let our polygon be at the same orientation as the direction of the wind.
- For the Length Column, set the following values:
- Point 1 = 0
- Point 2 = 1
- Point 3 = 1
This would let the 1 be the default lenght of our polygon
But this is still not enough to plot the current data in a plane, to do this we would use the 2 formula below to derive the X and Y coordinate of each wind vector then scale it to its wind speed
To create the viz, drop the following in each shelf/card.
Column Shelf : Wind X
Row Shelf : Wind Y
Mark Card
- Graph Type: Polygon
- Detail : Wind Direction
- Color : Wind Speed
- Path : Point
Pages Card : Date Time
The Resulting Viz would be seen below:
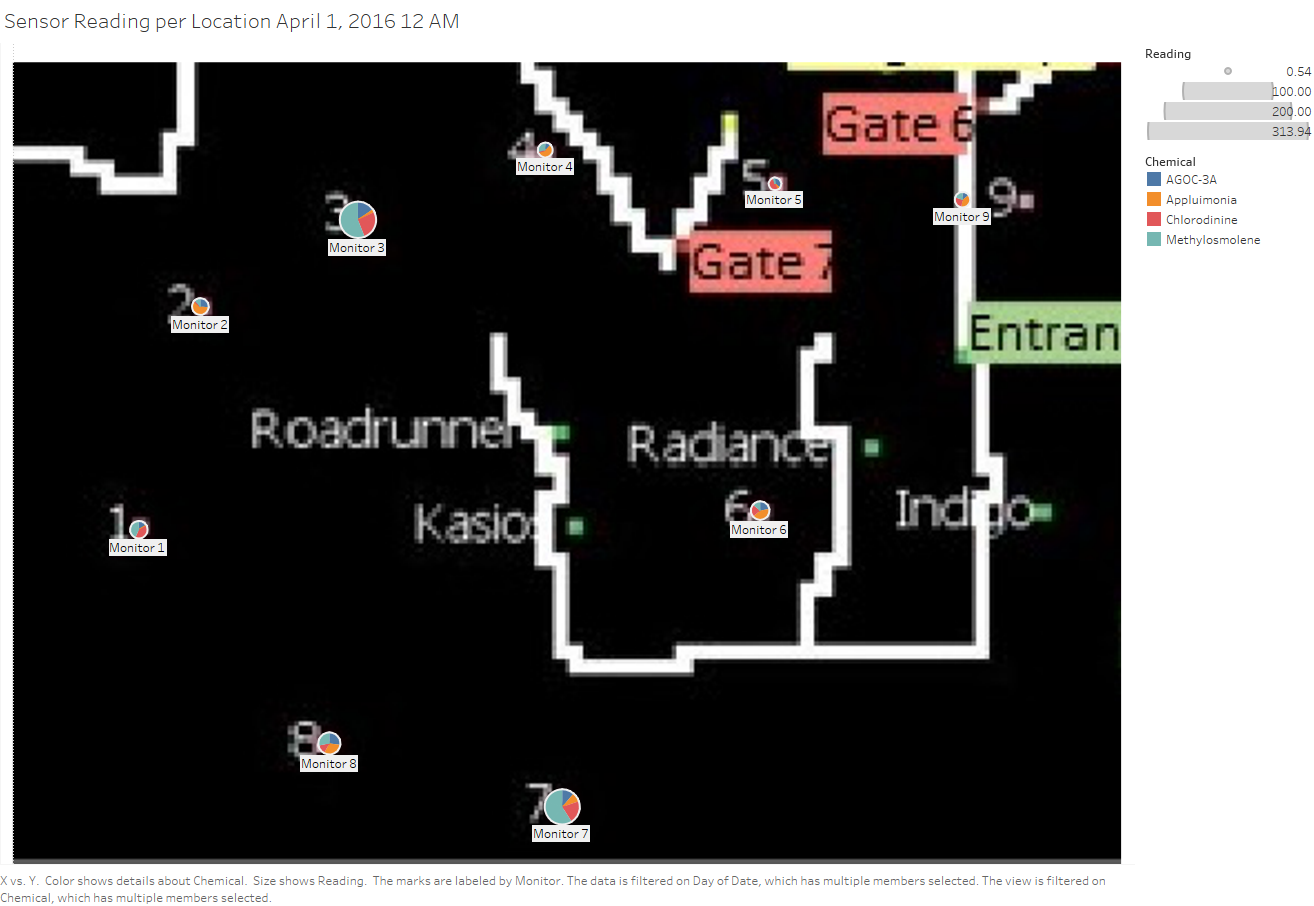
Next is we need to plot the sensor reading to the plane, for this we would need to crop the given Wildlife Preserve Map to a quadrilateral that just keeps the sensors and the factory and load it to Tableau as a background image
<<insert image of map here>> Caption : Factory and Sensor Map, 500 x 348 pixels
After which we can use Tableau to manually geocode the sensors by getting the X and Y coordinates
And finally to create the viz
Column Shelf : X Row Shelf : Y Mark Card Graph Type: Pie Size : Reading Angle : Reading Color : Chemical Label : Monitor Pages Card : Hour (Date)
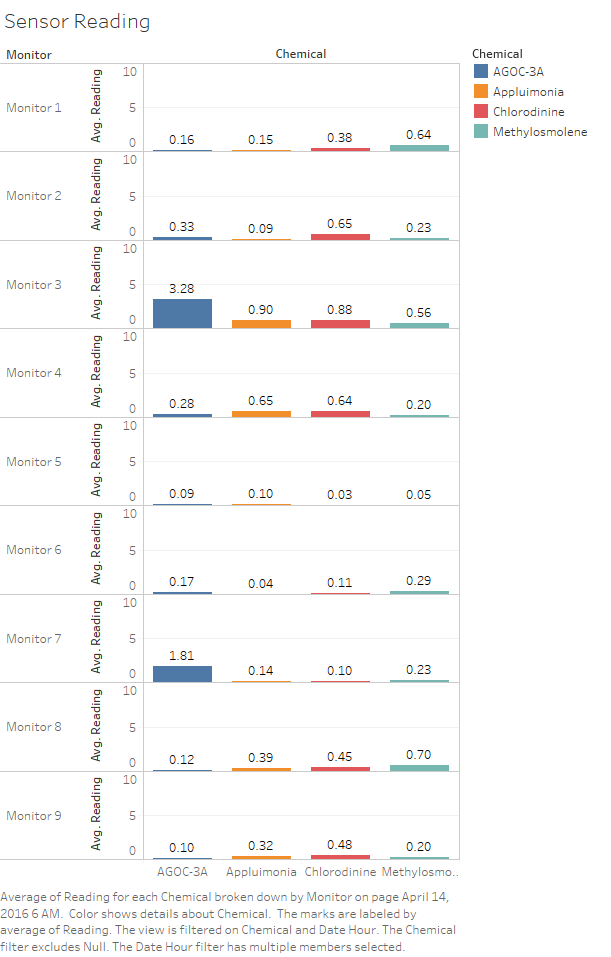
And to complete the viz to analyze to where the wind blows and where does it take our chemical particles we would need a viz that shows the absolute value of the readings per Monitor per Chemical, to do this we would need to:
Column Shelf : Chemical
Row Shelf : Monitor & AVG(Reading)
Mark Card
- Graph Type: Automatic
- Color : Chemical
- Label : AVG(Reading)
Pages Card : Hour (Date)
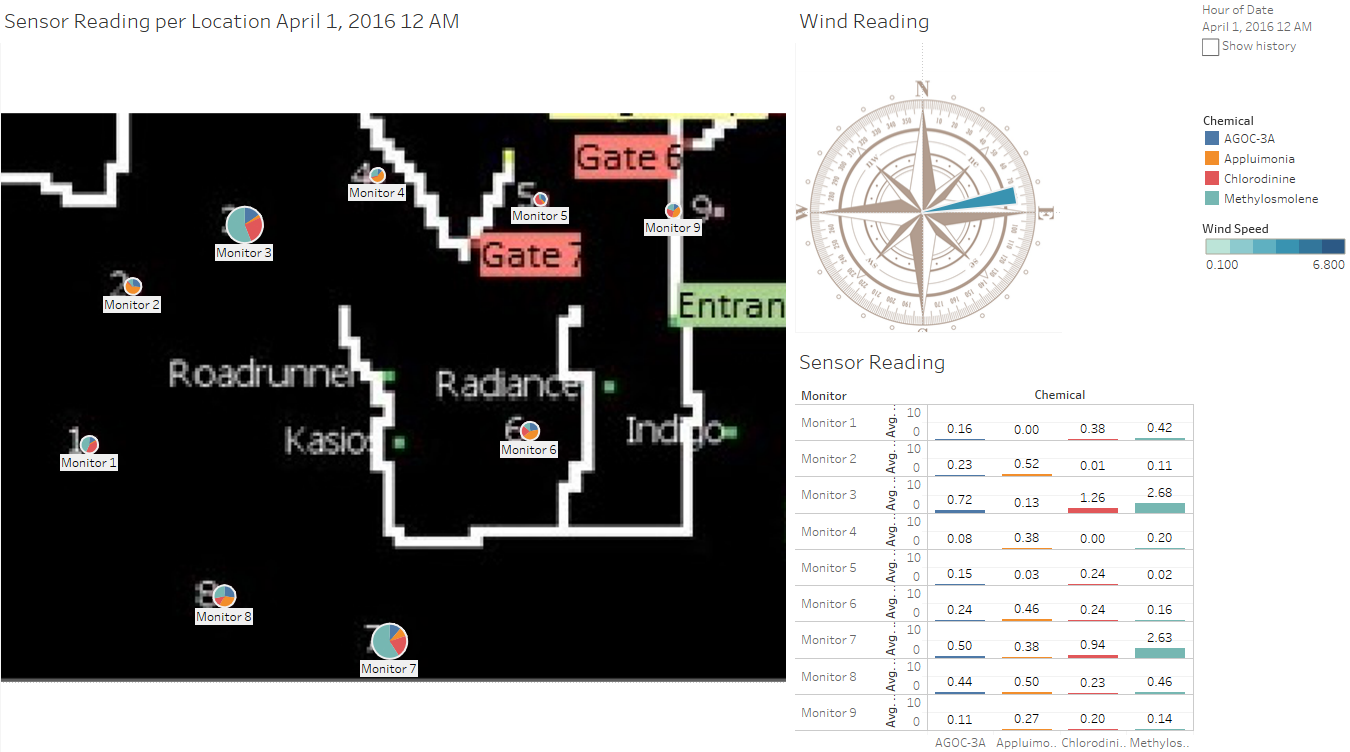
To create a Dashboard we would need to put all three graph and set up the following actions:
Run Action On: Select
- Source Sheet : Location Reading
- Target Sheet : Location Reading and Sensor Reading
- Target Highlighting : Selected Fields (Chemical and HOUR(Date))
The Resulting Dashboard


