ISSS608 2016-17 T3 Assign CHEN YINJUE Data Analytics
|
|
|
|
|
|
|
Data Visualization & Insights
1. Loading data into tableau
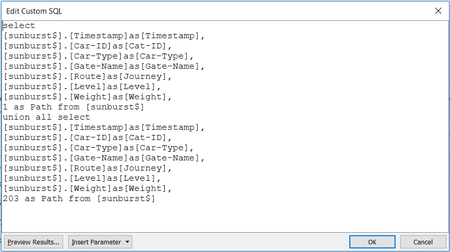
After data preparation, now it's time to draw sunburst chart in tableau. Firstly, open tableau, under ‘Connect’ click ‘Excel’ and then select the Excel file we prepared before. Noted that we should choose ‘open with legacy connection’ in this step so that custom SQL can be used later. Secondly, drag ‘New Custom SQL’ to the area with ‘Drag tables here’ and apply SQL code as below:
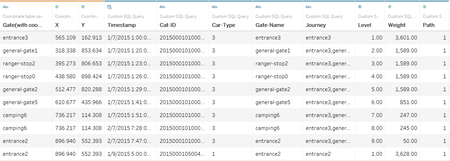
Besides, to lay out the path on the map later, the coordinate table should also be loaded into tableau. So, at the left pane of ‘Data source’, click ‘Add’ (to the right of ‘Connection’) and choose file ‘Coordinate table’. After that, we can select ‘Coordinate table’ under ‘Connection’ and drag ‘Coordinate table.csv’ to join with ‘Custom SQL Query’ by matching the ‘gate name’ of these two sheets. Below shows a sample of output:
2. Drawing the Sunburst Diagram
1) Step-by-Step Description
To prepare for doing sunburst diagram, a few calculation fields need to be created:
• Bar Level:
Index()
• Edges:
             IF [MaxLevel] > LOOKUP([MaxLevel],-1)
             THEN PREVIOUS_VALUE(0)
             ELSEIF [MaxLevel] <= LOOKUP([MaxLevel],-1)
             THEN PREVIOUS_VALUE(0) + LOOKUP([Size of Slice],-1)
             ELSE  PREVIOUS_VALUE(0) END
• Height of Bar:
[MaxWeight]/WINDOW_MAX([MaxWeight])
• index:
index()
• Label:
WINDOW_MAX(MAX([Gate-Name]))
• MaxLevel:
WINDOW_MAX(MAX([Level]))
• MaxWeight:
WINDOW_MAX(MAX([Weight]))
• Size of Slice:
[MaxWeight]/WINDOW_SUM(IIF([MaxLevel]=1,[MaxWeight]/203,0))
• Slice Level:
WINDOW_MAX(MAX([Level]))
• X(Sunburst):
             IF([Index]<>WINDOW_MAX([Index]) AND [Index]>=(WINDOW_MAX([Index])+1)/2)
             THEN
             ([Slice Level]+(10/[Band Thickness])+1-([Band Spacing]/5))* COS(WINDOW_MAX(2*PI())*[Edges]+
             (WINDOW_MAX([Index])-([Index]+1))*WINDOW_MAX(2*PI())*[Size of Slice]/(((WINDOW_MAX([Index])-1)/2)-1))
             ELSEIF([Index]=WINDOW_MAX([Index]) OR [Index]<(WINDOW_MAX([Index])+1)/2)
             THEN
             ([Slice Level] + (10/[Band Thickness]))* COS(WINDOW_MAX(2*PI())*[Edges]+(((IIF([Index]=WINDOW_MAX([Index]),
             1,[Index])-1)*WINDOW_MAX(2*PI())*[Size of Slice]/((((WINDOW_MAX([Index])-1)/2)-1)))))
             END
• Y(Sunburst):
             IF([Index]<>WINDOW_MAX([Index]) AND [Index]>=(WINDOW_MAX([Index])+1)/2)
             THEN
             ([Slice Level]+(10/[Band Thickness])+1-([Band Spacing]/5))* SIN(WINDOW_MAX(2*PI())*[Edges]+(WINDOW_MAX([Index])-
             ([Index]+1))*WINDOW_MAX(2*PI())*[Size of Slice]/((((WINDOW_MAX([Index])-1)/2)-1)))
             ELSEIF([Index]=WINDOW_MAX([Index]) OR [Index]<(WINDOW_MAX([Index])+1)/2)
             THEN
             ([Slice Level] + (10/[Band Thickness]))* SIN(WINDOW_MAX(2*PI())*[Edges]+(((IIF([Index]=WINDOW_MAX([Index]),
             1,[Index])-1)*WINDOW_MAX(2*PI())*[Size of Slice]/(((WINDOW_MAX([Index])-1)/2)-1))))
             END
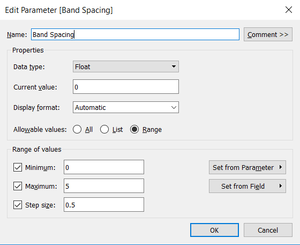
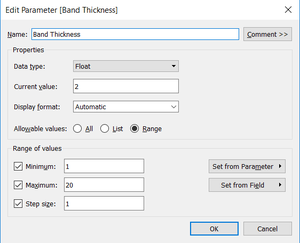
Also, several parameters need to be set:
• Band Spacing:
• Band Thickness:
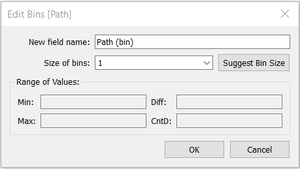
Create bin from 'Path' and name it as 'Path(bin)':
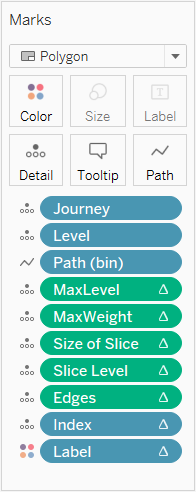
Finally, arrange all needed variables as below show:
Noted that different calculation fields need to be computed using one or multiple elements listed below:
2) Output & Discovery
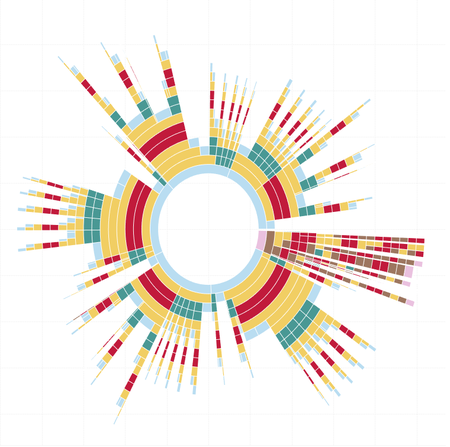
Below is the sunburst diagram showing from level 1 to level 20. To make the graph readable, I purposely colored same gate type with same color:
• Entrance: Blue
• General-Gate: Yellow
• Gate: Brown
• Campsite: Green
• Ranger-stop: Red
• Ranger-base: Purple
Now, from this sunburst chart, we can summarize several general route patterns:
1)) Cars that start from entrance:
• Cars that enter by an entrance and then directly exit the park by an entrance (can be either the same entrance or another entrance):
Entrance > Entrance
• Cars that enter the park and go through one or several general-gate(s) and then exit the park:
Entrance > General-gate(s) > Entrance
• Cars that enter the park for camping (basically includes all routes with campsites in):
Entrance > … > Camping(s) > … > Entrance
• Cars that enter the park and pass by ranger-stop(s) without going to any campsite:
Entrance > … > Ranger-stop(s) > … > Entrance
• Cars that enter the park and illegally pass by gate(s):
Entrance > … > Gate(s) > … > Entrance
2)) Cars that start from ranger-base, which basically should be cars with type ‘2P’. We should pay attention to checking whether there is any other car-type that illegally has this kind of route pattern.
3. Pattern Detection
1) Splitting Dataset
After attaining an overview as above, next we can begin to divide our datasets based on:
• Number of path of each car-id
• Duration of trip: one-day trip or multiple-day trip
Briefly, the restructured dataset can be divided into:
• Single path & Single day
• Single path & Multiple days
• Multiple paths
2) Grab the Patterns
As mentioned before, we have several patterns that can be viewed in sunburst chart already. Therefore, we can further divide the dataset based on route patterns. After that the weight of routes can be calculated and sorted and we pick up records whose routes have relatively heavier weights than others to treat them as major path pattern. Next, we can extract all specific data (those have heavier weight ones) to build calendar view so that the duration (which months or what hours) have heavier traffic for specific path patterns can be displayed, respectively. Besides, map can be used to demo the corridors. Details of steps are as below:
• Using the general route patterns summarized from sunburst to apply filter on the dataset, which are ‘Single path & Single day’, ‘Single path & Multiple days’ so that the original dataset can be further divided into several worksheets based on routes pattern, name the worksheets respectively (Noted that when using filter, we can just pick out the entire paths of similar route pattern to get a car-id list, then join the whole dataset (without filtering) with the car-id list table).
• Next, each worksheet can be loaded into JMP to calculate weights of different routes (noted only entire paths’ weight will be used to analyse) so that those entire paths with higher number of records can be picked out as major trip patterns.
• Then data will be further extracted from the filtering dataset based on the major trip patterns that we got from step two. By now, the timestamp of these data can be used to build the calendar view so that we can know which duration (months within a year or hours within a day) have bigger traffic volumes.
• Using map to lay out the specific path pattern.
1)) ‘Single path & Single day’
Based on the analysis steps described above, we can get these several route patterns from the dataset:
• Entrance > Entrance
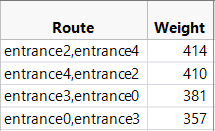
For this specific short route pattern, it is discovered that entrance0, entrance2, entrance3, entrance4 have occurred very frequently:
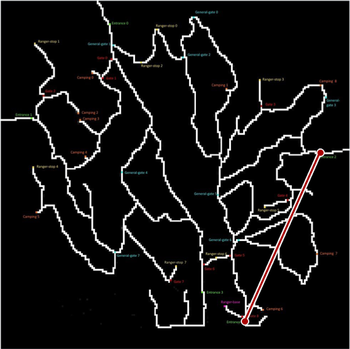
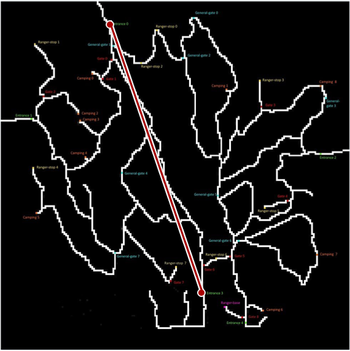
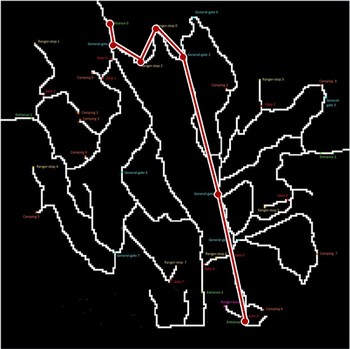
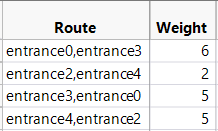
Although there are four paths shown above, we can summarize the patterns as: one route between entrance2 & 4 while the other path is between entrance0 & 3.
Path 1: between entrance2 and entrance4 (number of records:824):
Path 2: between entrance0 and entrance3 (number of records:738):
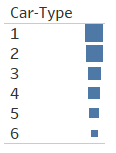
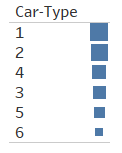
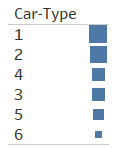
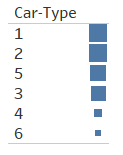
Car-type 1 occurs most in this route pattern, followed by type 2, type 3 and type 4, orderly. Type 1 & 2 have quite close number of records while type 3 & 4 also have similar weights. Moreover, records of type 6 is much less than the others while type 2P doesn't exist in this pattern:
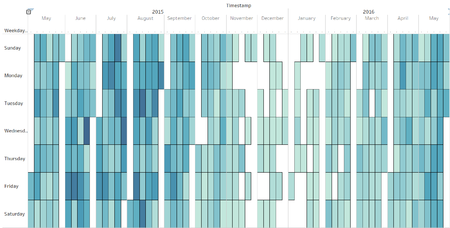
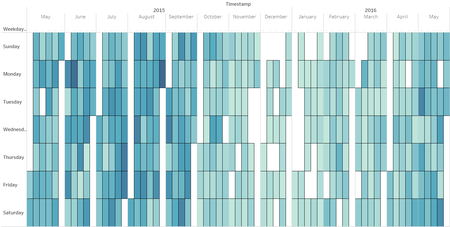
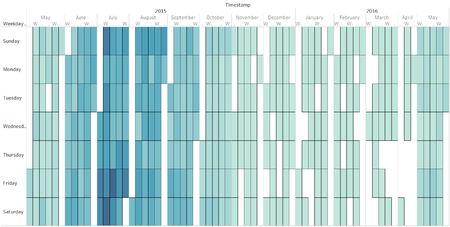
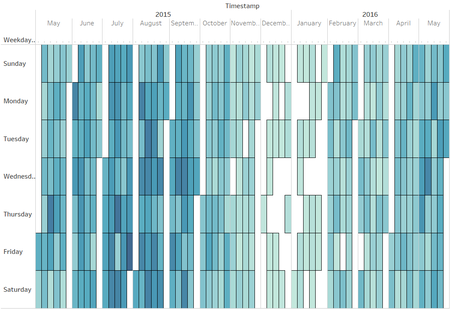
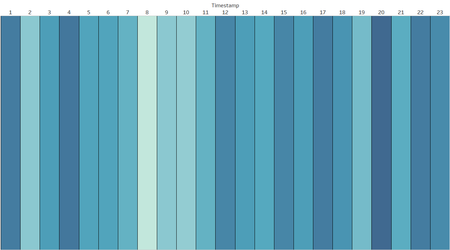
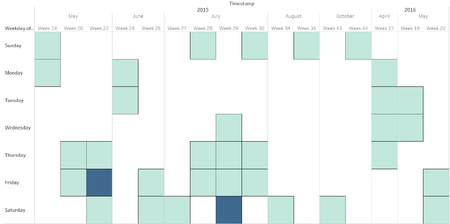
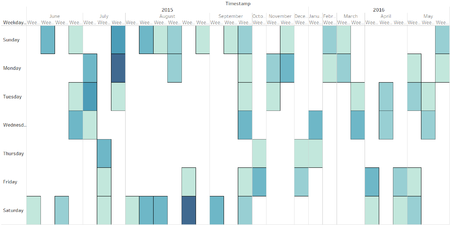
From calendar, firstly, it can be seen from the charts that during November to January, there are relatively much less records of this kind of pattern compared to other months. Besides, during June to August there are obviously more path records, especially July and August.
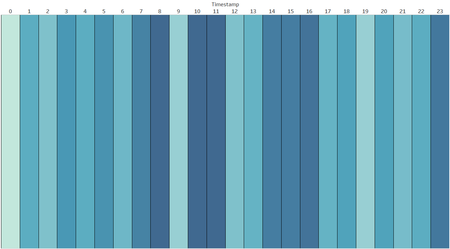
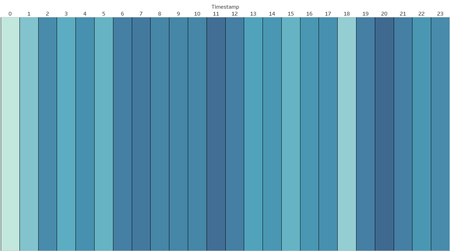
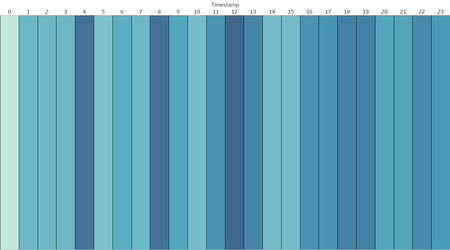
For route between entrance2 and entrance4, records more frequently occurred during midnight, especially 3am. Also, quite a lot records at dusk (6pm):
Meanwhile, for path between entrance0 and entrance3, most records happened early in the morning (6am) as well as around noon (11am and 2pm~3pm):
• Entrance > General-gate(s) > Entrance
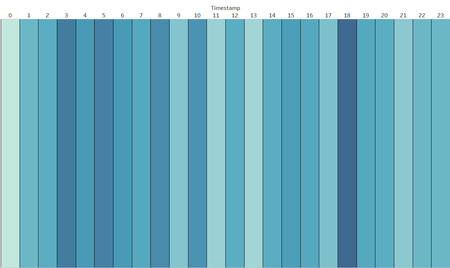
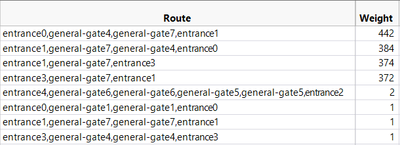
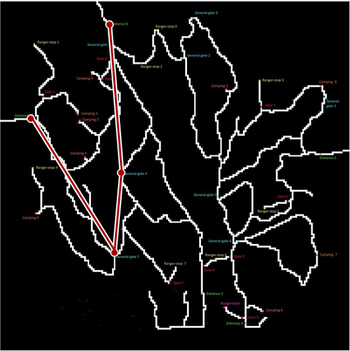
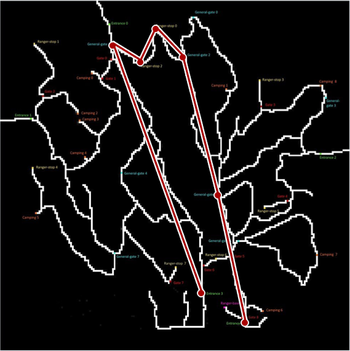
Similarly, as before, we can summarize a route, which goes through entrance0, general-gate4, general-gate7, entrance1, has quite heavy weight that equals to 826 (including both directions). Moreover, there is another path pattern has quite a lot number of records (746) also, which is the one goes through entrance3, general-gate7 and entrance1 (both directions also):
Path1: goes through entrance0, general-gate4, general-gate7, entrance1 (826 records):
Path2: goes through entrance3, general-gate7, entrance1 (746 records):
For this pattern, Car-type 1 occurs most in this route pattern, followed by type 2, type 4 and type 3, orderly. Type 1 & 2 have quite close number of records while record of type 4 is slightly more than that of type 3. Moreover, records of type 6 is much less than the others while type 2P doesn't exist in this pattern:
It can be seen from the calendar view below that, from November, records of this route pattern begin to decrease till February. Between June and September this path pattern happened relatively more frequent.
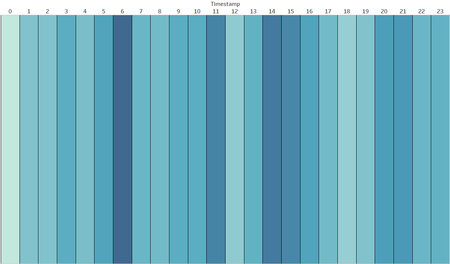
Cars go through path 1 tend to drive in the morning except for 9am. Also, 2pm~4pm is another duration that have relatively heavier weights as well as 11pm:
Traffics of path 2 tend to occur from early morning till noon (6am~12pm) as well as from dusk till midnight (7pm~11pm):
• Entrance > … > Camping(s) > … > Entrance
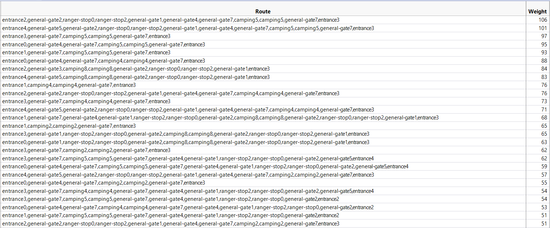
Below show paths that have been to campsites with number of records more than 30. Based on this we can make an educated guess that paths been to camping 6 have the heaviest weight. Likewise, camping 3 is the second most popular campsite.
Because paths been to campsites are too dispersive, it doesn’t make sense to perform same analysis steps as other route patterns here. We just have a look at car types and calendar views to get better overview of routes that include campsites.
Only car type 1, 2, 3 pay visit to campsites. Records of type 1 are much more than that of type 2 and 3, which have similar number of records compared to each other:
Camping is most popular with visitors during June to September, especially July. Meanwhile among other months, there are still records but not that much.
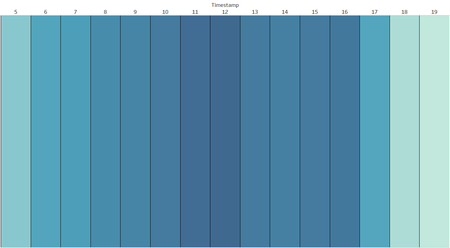
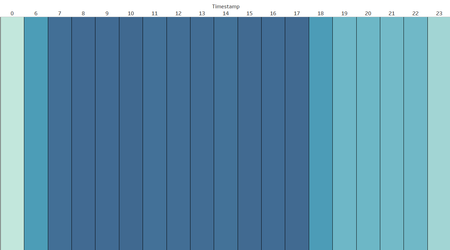
All records occur during 5am to 7pm, especially during day time (8am~4pm):
• Entrance > … > Ranger-stop(s) > … > Entrance
For this pattern, we can summarize three routes (two-way) whose weights are heavier:
Path1: goes through entrance4, general-gate5, general-gate2, ranger-stop0, ranger-stop2, general-gate1, general-gate4, general-gate7, entrance1(number of records:796):
Path2: goes through entrance0, general-gate1, ranger-stop2, ranger-stop0, general-gate2, general-gate5, entrance4 (number of records:734):
Path3: goes through entrance3, general-gate1, ranger-stop2, ranger-stop0, general-gate2, general-gate5, entrance4 (number of records:734):
Car-type 1 occurs most in these kinds of route pattern, followed by car-type 2. Car-type 4’s records are slightly more than type 3. Besides, car-type 6 is not that common in there several patterns.
Traffics of these several paths tend to happen between May and September, especially from July to September. During November to April records are relatively less, especially December and January. In fact, records start to decrease from November and begin to increase from February.
Path1: Records occur more frequently after noon till midnight compared to that during morning:
Path2: Records occur most at three specific timestamp, which are 4am, 8am, 12pm:
Path3: Records of this path distribute quite uniform among different hours, except for 12am whose record is obviously much less than others:
• Entrance > … > Gate(s) > … > Entrance
In fact, only ‘2P’ can cross gates. However, from the line graph below we can see that besides ‘2P’ there is another type of car, which is type 4 (represented by green line) that also have some path records including ‘gate’. It is unusual and we need to catch them!
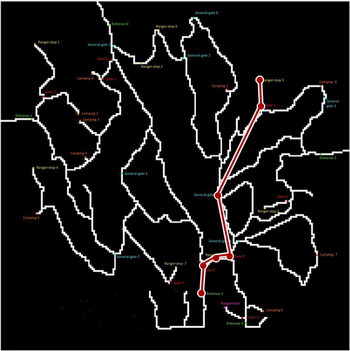
After processing data in JMP, we get to know that there are totally 23 records of this path:
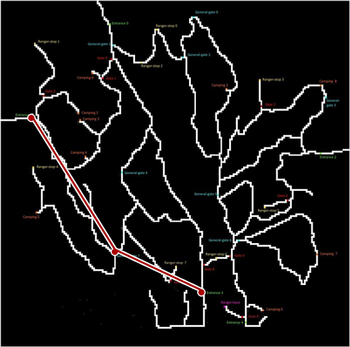
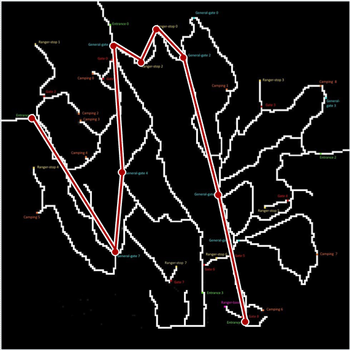
Showing the route on the map is like below:
As we mentioned before, only car-type 4 illegally appeared in this kind of route pattern:
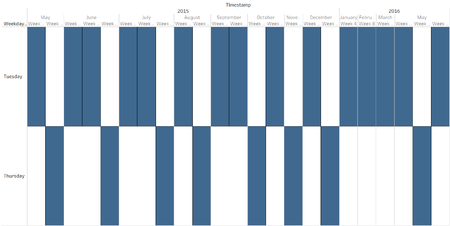
So, when did this happen? Looking into details of picture below, it can be found that there is either one or two records per month. Besides, all records appear on either Tuesday or Thursday:
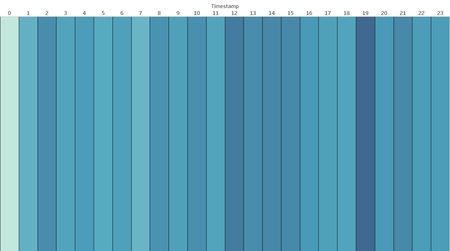
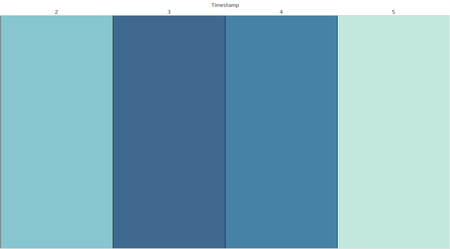
When it comes to which hours did these records occur, well, all records occur during 2am to 5am. Among these four hours, 3am and 4am got more frequencies:
2)) ‘Single path & Multiple days’
• Entrance > Entrance
For this specific short route pattern, again only entrance0, entrance2, entrance3, entrance4 have occurred. In fact, the routes are just the same as those one-day-trip paths that enter and then exit the park without having any other gate-name records:
So, basically we can take a look at car-type of these records and grab an overview from calendar views as well.
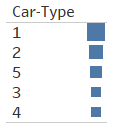
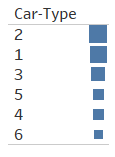
Car type 1 has most records, followed by type 2, 5, 3 and 4, orderly. This time type 6 doesn’t exist. And the frequency-sorting of car-type is a bit different from that of single-day trip:
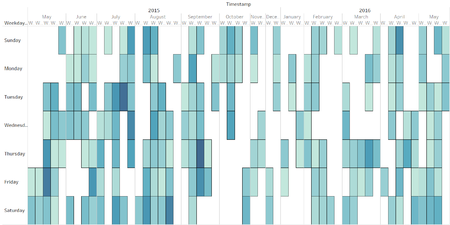
This kind of records only appear at certain months. There is a Friday in May, 2015 has relatively more records than other days, same situation occur on another Saturday in July, 2015.
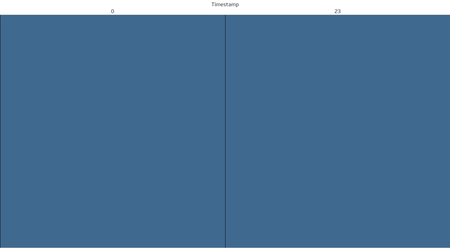
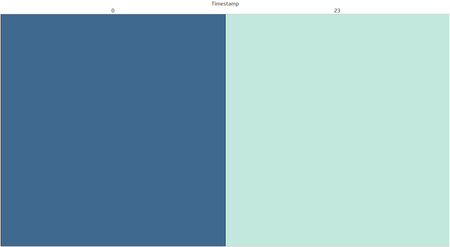
All records appear during 11pm to 12am. In fact, this is not a multiple-day trip. It's just because the cars enter the park near midnight and hence when they exit the park it's already another day. Therefore, we can actually combine this multiple-day pattern with the corresponding single-day one.
• Entrance > General-gate(s) > Entrance
One route can be summarized as path 1 (two-way) goes through entrance 0, general-gate 4, general-gate 7 and entrance 1. Another path 2 (also two-way) goes through entrance 1, general-gate 7 and entrance 3.
Path 1:
Path 2:
Car type 1 and 2 are the cars that occur most frequently and second frequently in this kind of pattern, Also, they have very close number of records. While type 5 and 3 also have similar records that rank at third and fourth. Type 4 and 6 have very few frequency of this pattern.
This pattern has quite few records, which happen most frequently in July and August, compared to other route patterns.
In fact, paths of this pattern are as same as those of pattern that enters the park, goes through general-gate(s) and then exit the park in single day.
The difference is just the timestamp that the records occur. For this multiple days situation, it is because that these cars enter the parks in late evening (11pm) and exit the park after midnight (12am). Therefore, we can actually combine this multiple-day pattern with the corresponding single-day one.
• Entrance > … > Ranger-stop(s) > … > Entrance
For cars that have one trip that last for multiple days to the park, below show paths passing by ranger-stops without going to any campsites. It’s found that in this kind of route pattern, cars all pass by ranger-stop 0 and ranger-stop 2 rather than any other ranger-stops.
This time, car type 2 has most records of this kind of route pattern, followed by type 1, 3, 5, 4, 6. Type 1 and 2 have quite similar number of records. So, does type 5, 4 and 6. Again, type 2P doesn’t appear in this pattern:
Records appear more frequently during May to September while from October to April records are relatively few:
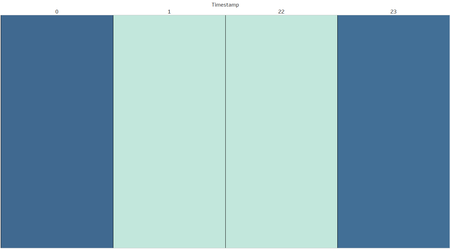
This route pattern all happens between 10pm and 1am, especially within 11pm to 12am:
• Entrance > … > Camping(s) > … > Entrance
Below show paths that have been to campsites with number of records more than 50. Based on this we can make an educated guess that paths been to camping 2, 4, 5, 8 have heavier weights compared to others, especially camping 5, which should be the most popular campsite for multiple-day camping trip with people.
Because paths been to campsites are too dispersive, it doesn’t make sense to perform same analysis steps as other route patterns here. We just have a look at car types and calendar views to get better overview of routes that include campsites.
Only car type 1, 2, 3 pay visit to campsites. Records of type 1 are much more than that of type 2 and 3. Also records of type3 are much less than that of type 2:
July has most visitors visiting campsites for multiple-day trips. Also, June, August and September have quite a lot records. Meanwhile, among other months, there are not that many people travel to campsites, especially during November to March.
Different from routes been to campsites in one-day trip, this time records have spread out in whole day. However, most traffics occur during day time, which is from 7am to 5pm.
3)) ‘Multiple Paths’
For those cars that have more than one trip records, below are several id that we would like to pay attentions to:
Car_id: 20154519024544-322
• entrance1, camping4, camping4, general-gate7, general-gate4, general-gate1, ranger-stop2, ranger-stop0, general-gate2, general-gate5, entrance4 (1 record)
• entrance4, general-gate5, general-gate2, ranger-stop0, ranger-stop2, general-gate1, general-gate4, general-gate7, camping4, camping4, general-gate7, general-gate4, general-gate1, ranger-stop2, ranger-stop0, general-gate2, general-gate5, entrance4 (15 records)
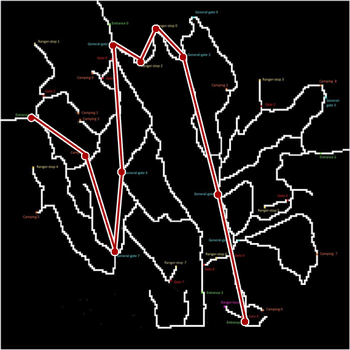
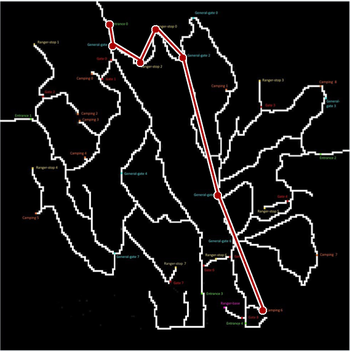
It's found that car_id "322", whose car_type is "2", likes going to camping 4 very much that all of its trips have been there and all the trips have same path except for the first journey. Below is the path with 15 records showing on the map:
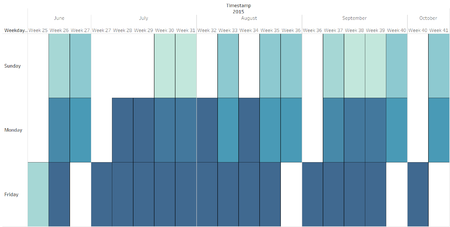
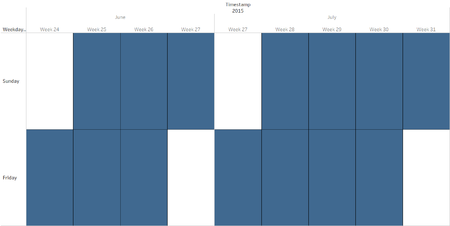
Car “322” only went to the park during June to October and only on Sunday, Monday and Friday, especially Monday and Friday.
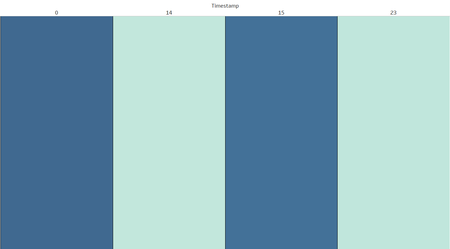
When it comes to travelling hour, this car only drives in the afternoon (2pm~3pm) and late in the evening (11pm~12am).
Car_id: 20154112014114-381
• entrance0, general-gate1, ranger-stop2, ranger-stop0, general-gate2, general-gate5, camping6, camping6, general-gate5, general-gate2, ranger-stop0, ranger-stop2, general-gate1, entrance0 (7 records)
It's found that car_id "381", whose car_type is "1", likes going to camping 6 very much that all of its trips have been there and all the trips have same route. Below is the path with 7 records showing on the map:
Car “381” only went to the park in June and July and only on Sunday and Friday.
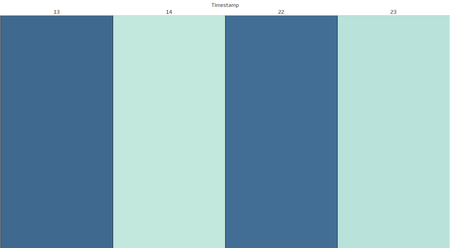
When it comes to travelling hour, this car only drives just after noon (1pm~2pm) and late in the evening (10pm~11am).
Car_id: 20162904122951-717
• entrance3, general-gate7, camping0, camping0, general-gate7, entrance3 (6 records)
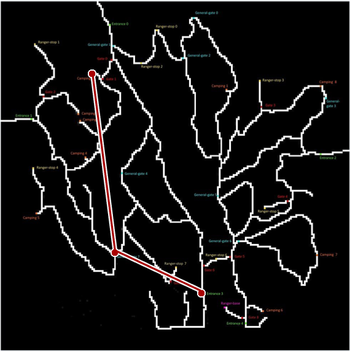
It's found that car_id "717", whose car_type is "1", likes going to camping 0 very much that all of its trips have been there and all the trips have same route. Below is the path with 6 records showing on the map:
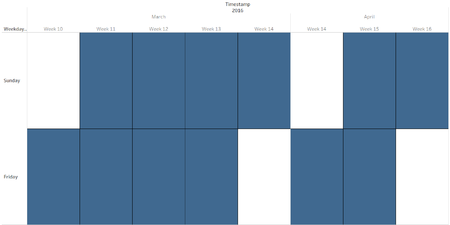
Car “717” only went to the park in March and April and only on Sunday and Friday.
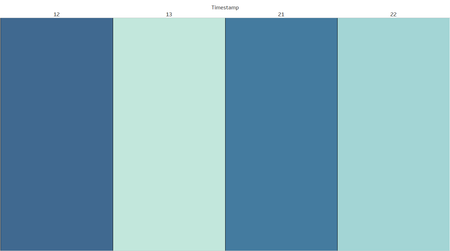
When it comes to travelling hour, this car only drives around noon (12pm~1pm) and late in the evening (9pm~10am).
Car_id: 20153712013720-181
• entrance3, general-gate7, camping0, camping0, general-gate7, entrance3 (6 records)
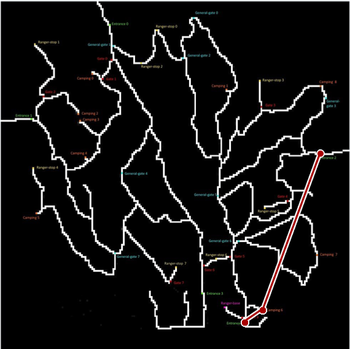
It's found that car_id "181", whose car_type is "3", likes going to camping 6 very much that all of its trips have been there and all the trips have same route. Below is the path with 4 records showing on the map:
All the records are in July and August and only on Sunday and Tuesday.
When it comes to travelling hour, this car only drives at 1pm and 10pm.

