Motivation
In recent years, terrorism attacks in the western world are the centre of focus and receive extensive reporting. However, terrorist attacks in the Middle East, South America, Africa and South Asia often receive much less attention or totally neglected. This creates a perspective that is far from the truth. We aim to present a holistic picture of the global terrorist attacks: across time, countries, targets and methods, to help the viewers have a better understanding of terrorist attacks in various countries during different periods of time.
Related Work
|
Related Works
|
Learning Points
|
| Example 1 Source
|
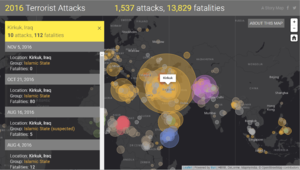
- Interactivity - Being able to click on a country and see the number of fatalities and attacks. Also has the option of clicking on recent attacks and seeing where it occurred on the map.
- Design - opacity and colours of the proportional symbols allows users to see which areas have been heavily attacked
|
| Example 2 Source
|
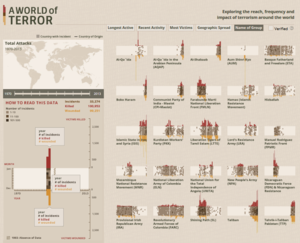
- Interactivity - Allows users to view more information about each terrorist group (i.e. timeline, magnitude of attacks, how many injured and killed from attacks done by this group)
- Design - neutral colour palette with some outstanding colours (i.e. red and yellow) to highlight certain values.
- Filter function - allows the users to filter the data on a timeline if they want to zoom in to a specific timeline.
|
| Example 3 Source
|
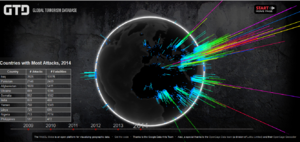
- Interactivity - Globe can be shifted around for you to view other sides of the globe.
- Timeline - allows users to view the distribution of attacks across the globe, in a specific year.
- Details bar - Provides users with more information that they would need to know. i.e. Countries with the most attacks and the most fatalities.
|


