ISSS608 2016-17 T1 Assign3 Lim Hui Ting Jaclyn Q3
The crime occurred on Sunday, and was discovered at around 1130am to 1230pm by the visitors. We can see this from the increase in communication data to the helpline, external contacts, as mentioned in the previous findings.
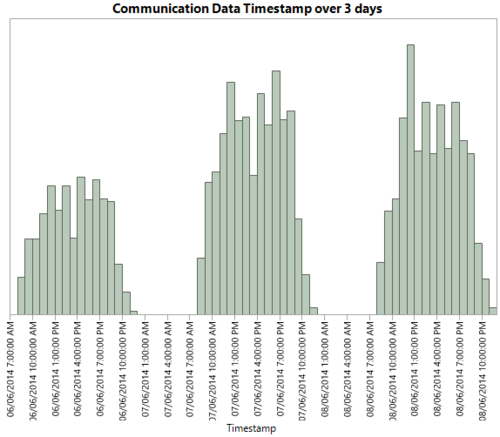
Looking at the total communication data timestamp over the three days (i.e. the histogram below), we can see that although there was a drop in the number of visitors on Sunday, there were significantly more communication going on, on Sunday itself. The highest peak of communication across the three days occurred between 12pm to 1pm. As such, it is highly likely that something happened in the park, that caused a commotion between the visitors themselves.
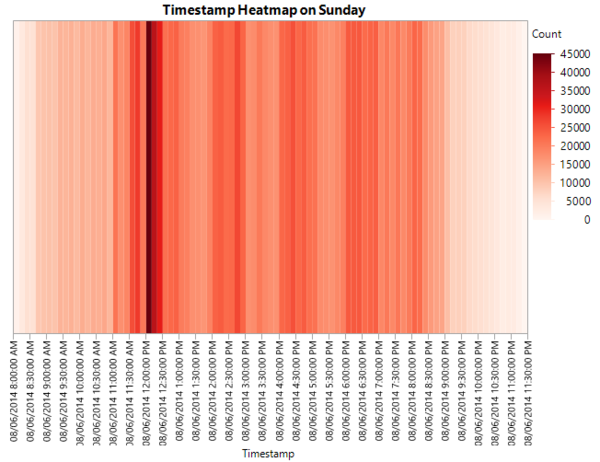
Hence, I created a heatmap to visualise the exact timing on Sunday, when most people may have discovered the crime. The heatmap below is on a range of intensity of red, the darkest shade representing the most number of communication data. As we can see, the 10 minute time frame was between 12.00pm to 12.10pm, where most people had discovered the crime.
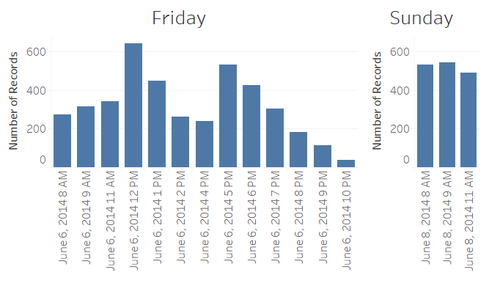
The crime was likely to have occurred in Creighton Pavilion, where Scott Jones was, before 12pm. In the graph below, the check-in movement data at Creighton Pavilion on Friday and Sunday were compared, and from here, we can see the that there were no more check-in data after 12pm. From the bar chart below, it can be hypothesized that the visitors who entered the pavilion at 1130 am discovered the damage, and reported it. As such, after 12pm, there were no more visitors entering the park, since the pavilion was closed due to the vandalism that took place, and the need for the park operators to survey the damage and find evidences leading to the suspect.


