ISSS608 2016-17 T1 Assign3 Lim Hui Ting Jaclyn Q2
Contents
Pattern 1
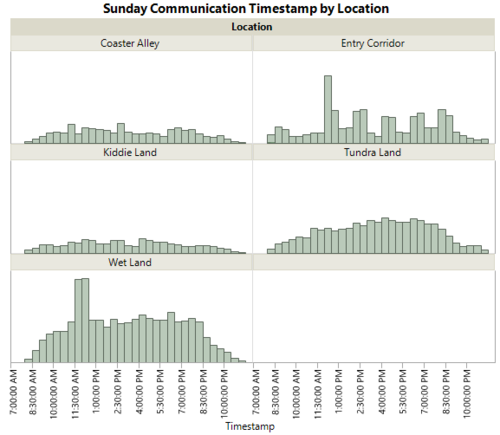
There are generally two peaks in the communication data each day, 11am-3pm and 4pm to 9pm. Also, consistent throughout the days is a sharp drop in communication that takes place between 3pm to 4pm. We can also observe that there is a large spike of communication on Sunday, between 11am to 12pm. Since the general trend of communication data varies by the number of visitors in the park during that day, there should have been a lower peak of data between 11am to 12pm on Sunday. Hence, the spike observed is probably due to the vandalism that had taken place.
Pattern 2
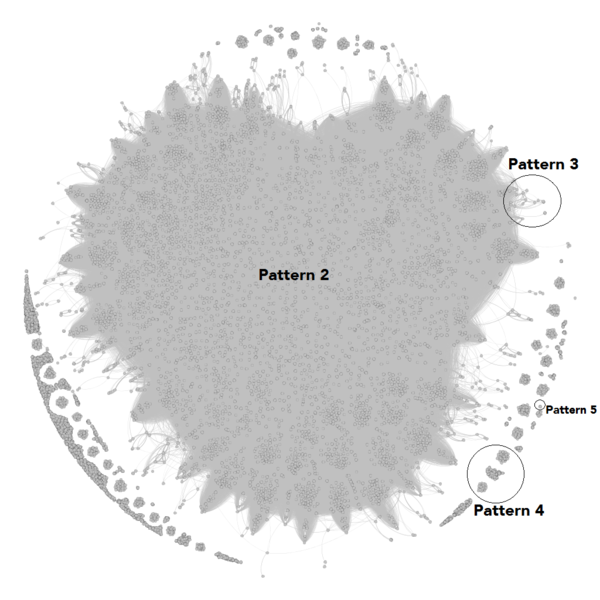
Most of the communication that takes place within the park are interlinked. In the graph, most of the nodes are connected by edges in the center of the graph. As the graph below does not include IDs 839746, 1278894 and external nodes, this means that the majority of the park visitors have the chance of interacting with each other. It was also found that 3555 IDs were found to have communicated with 100 and more IDs. This could be because park goers have the chance to meet new friends in the park or via the application and communicate with them.
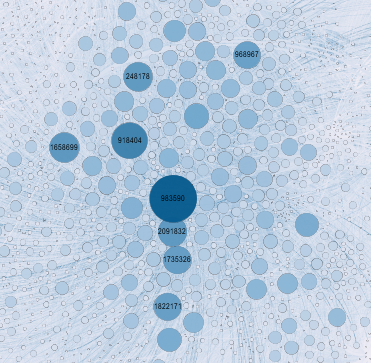
Also, it can be observed that there are significantly larger nodes in the centre of this graph. The nodes with the largest degrees are ID 983590, followed by 918404 and then 248178, 1822171, 1658699, 2091832, 1735326, 1822171, 968967. This can be seen in the image below.
Pattern 3
It can be observed that some of these nodes are somewhat connected to the nodes of pattern 2 that are highly connected. These nodes have very few edges connecting to the cluster in the middle. This means that this represents people who communicate lesser, but still have some form of communication with the main group of visitors in the park. Hence, this group represents people who have had little communication, and are probably alone or travelling in small groups in the park for prolonged periods of time.
Pattern 4
Another pattern that can be observed in the network graph (above), would be that there are also a large number of IDs (or nodes) representing people who do not interact with the main group of visitors. Within this group of people, there are clusters who interact solely with each other. This probably represents small clusters of people who come to the park together, and prefer to interact only with each other. As such, these are also nodes that have high closeness centrality, as they are able to reach each other more quickly.
Pattern 5
The final communication pattern that can be observed from the first graph (above), would be that there are people who only communicate with external parties. Hence, the nodes that represent this group of people, do not have connecting edges (since the "external" node was removed). This probably represents people who go to the park on their own, and use the application to communicate only with outsiders.
Pattern 6
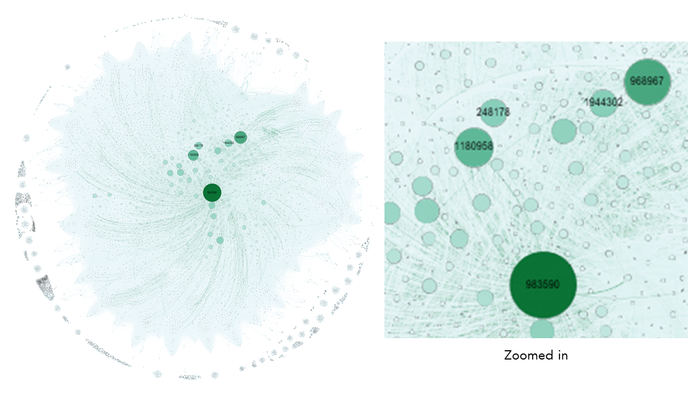
It can be hypothesized that there are group leaders present in the data set. In the graph above, there are many nodes in the darker shade of blue. This means that these nodes have high betweenness centrality values. Hence, the nodes in the darker shades would probably represent key figures within the network who have connections to a large group of visitors, and probably disseminate information to them on a timely basis. Such nodes will include nodes: 983590, 968967, 1180958, 1944302, 248178.
Pattern 7
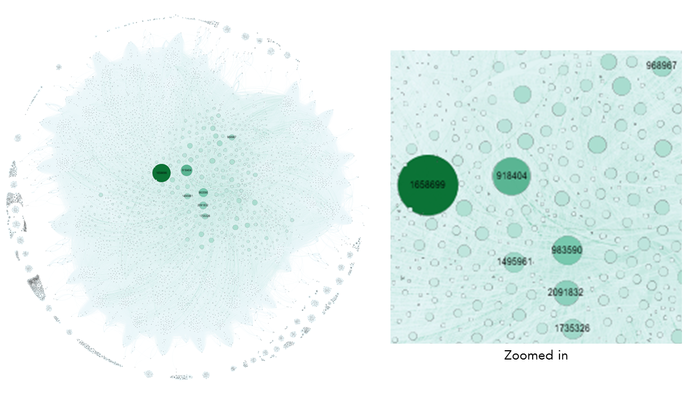
The graph above represents the IDs that are the most important in the network. From here, we can see that nodes that are the darkest represent the IDs that are of the most importance, as they have the largest eignevector centrality measures. These nodes are generally well connected with other nodes that are of high importance in the network. These IDs are also present in the middle of the network, signifying that they have high connections with most of the nodes in the network. The nodes with the highest Eigenvector Centrality values above 0.9 are: 1658699, 918404, 983590, 2091832, 1495961, 1735326 and 968967.
Pattern 8
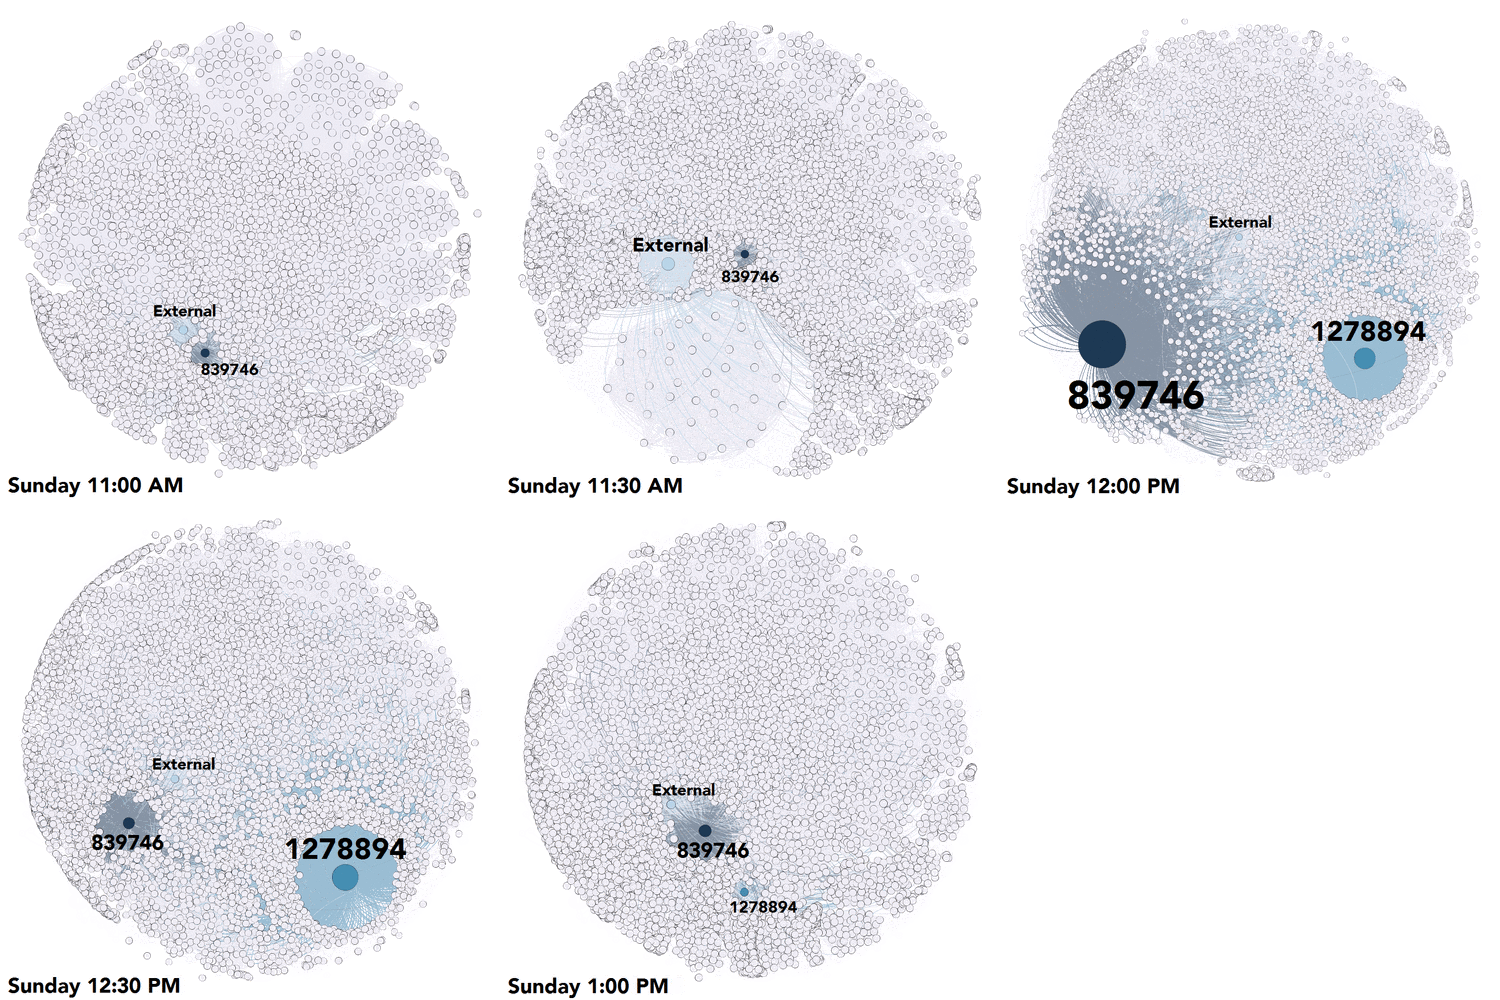
There is a spike of communication data at 1130am to 12pm, that mostly took place from Wet Land and Entry Corridor. These are the visitors are the one who have reported to the helpline, as well as to each other. Between 12pm to 1230pm, there were a total of 22097 instances of communication with the helpline (ID 839736), which made up about 20% of the total communication at this timeframe. This means that more visitors were aware of the crime that occurred, and took measures to report it, at this timeframe.
Pattern 9
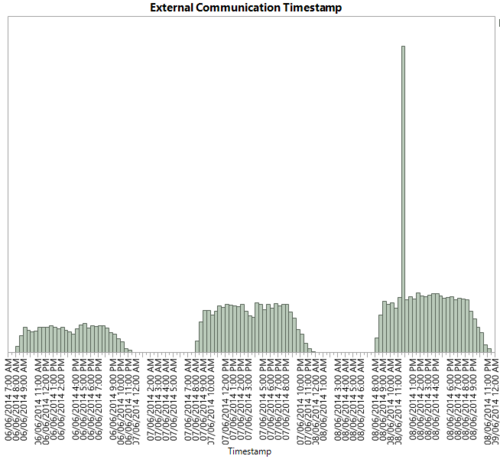
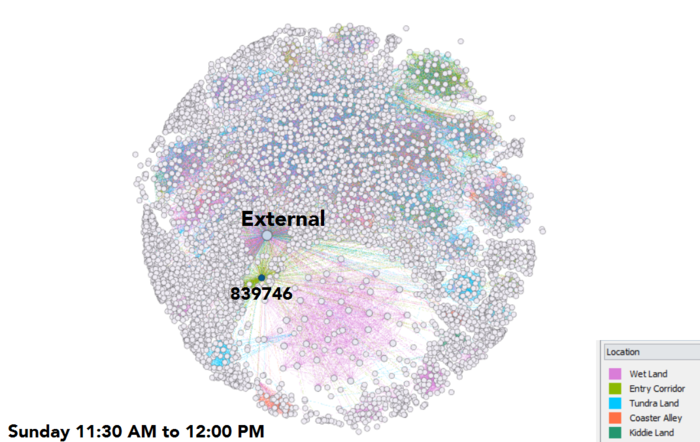
The volume of external communication increased largely between 1130am to 1200pm, as seen from the bar chart distribution graph above. This is because the visitors who entered Creighton Pavilion (located in Wet Land Zone) discovered the crime at that point in time. As such, as seen in the network graph above, the amount of external data was mostly from Wet Land Zone (represented by purple edges). This means that upon seeing the vandalism, many visitors started to share what they saw with people located outside the park.
Pattern 10
From the image above, we can see the changes in communication patterns from 1100am to 130pm. As mentioned earlier, there was a spike in communication data from 1200pm to 1230pm to the helpline. In addition, from here, we can see that the hourly trivial game was still ongoing, and park goers were still participating in the game despite the occurrence of the vandalism. This means that most people who were not in the vicinity were not aware of it when it occurred.


