ISSS608 2016-17 T1 Assign2 Ong Han Ying - Data Preparation After Design Iteration
|
|
|
|
|
|
|
|
|
|
|
5.5: Additional Data Identified from Design Iteration
This section highlights the additional data preparation work that is identified in Section 6: Approach.
This is aligned with the overview of data preparation in Section 5.0: Overview where additional data may be required at the visualization & analysis stage.
5.5.1: Rephrasing the Survey Questions
With reference to 6.2.2: Analysing Categorical Data, the survey questions has been shortened, as below;
5.5.2: Creating Manual Binning
With reference to 6.2.3: Analysing Interval Data, manual binning are created in the dataset (through MS EXCEL's formula), as below;
| Field Name | Formula | Output |
|---|---|---|
| AGE_Manual_Bin_1 | =IF([AGE]="","",IF([AGE]<=30,"<=30",IF([AGE]<=40,"31-40",IF([AGE]<=50,"41-50",IF([AGE]<=60,"51-60",">60"))))) | "<=30", "31-40", "41-50", "51-60", ">60" |
| AGE_Manual_Bin_2 | =IF([AGE]="","",IF([AGE]<=30,"21-30",IF([AGE]<=40,"31-40",IF([AGE]<=50,"41-50",IF([AGE]<=60,"51-60","61-70"))))) | "21-30", "31-40", "41-50", "51-60", "61-70" |
| YEARSEXP_Manual_binning_2 | =IF([YEAREXP]="","",IF([YEAREXP]<=10,"0-10",IF([YEAREXP]<=20,"11-20",IF([YEAREXP]<=30,"21-30",IF([YEAREXP]<=40,"31-40","41-50"))))) | "0-10", "11-20","21-30","31-40", "41-50" |
5.5.3: Adding #ID to the Survey Result's Dataset
From 6.2.4: Computing Survey Results - Using Frequency Tables, it was identified that #ID has to be added to the dataset. As such, #ID is added to the excel file, and "wiki4H_SurveyResultTable_Final_V2.xlsx" is created, to support the analysis. The implementation steps as display below;
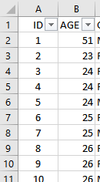
Step1 : Assigning Unique #ID into the dataset,
Step2 : Load the Dataset into Tableau, and do a "pivot", as below;
5.5.4: Joining Survey Results' Table and Survey Master's Table
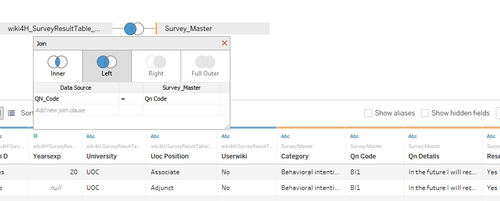
From 6.2.4: Computing Survey Results - Using Frequency Tables, it was also identified that the 2 tables of "Survey Results", and "Survey Master" has to be joined, so to support the analysis. The implementation steps as completed in tableau, and as display below;
5.5.5: Creating an "Indicator_Master" and Joining the Tables
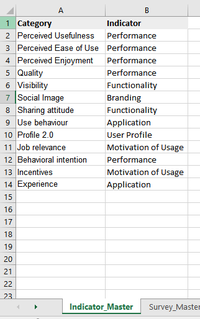
From 6.2.4: Computing Survey Results - Using Frequency Tables, it was identified that the a new table of "Indicator_Master" has to be created, and then, to be joined to the Master Dataset, so to support the analysis. The implementation steps as completed in tableau, and as display below;
Step 1: Creating a new worksheet of "Indicator_Master" in "Survey_Master.xlsx";
Step 2: Joining "Indicator_Master" table, to the master table, as below;
5.5.6: Research Paper's Hypothesis
From 6.1.2: Objective 2 - To Identify Further Insights to the Conclusion of the Research Paper, it was identified that the summary of the hypothesis from the research paper is not available. As such, a new table of "Hypothese" is created in the excel database of "Survey_QN_Master" to support the analysis. The summary of the table as below;
| Field Name | Description |
|---|---|
| Hypothesis Code | Hypothesis Code, such as H1 etc |
| Description | Description of the Hypothesis |
| Qn_Code | Question Code |
Next, this table is joined to the other table, as below;
Previous Sub-section: Initial Preparation Work


