Atom FinalWiki
|
|
Contents
- 1 ABSTRACT
- 2 INTRODUCTION
- 3 LITERATURE REVIEW
- 4 TOOLS & TECHNOLOGY
- 5 DATA COLLECTION AND DATASETS
- 6 PHASE 1 ANALYSIS METHODOLOGY
- 7 PHASE 2 ANALYTICS METHODOLOGY
- 8 EXPLORATORY DATA ANALYSIS
- 9 FINDINGS AND ANALYSIS
- 10 CONCLUSION
ABSTRACT
In Singapore, roads today already take up 12% of its total land area and with the limited land available. Singapore cannot afford to exhaust its land area by building more roads to accommodate vehicles and further expand the road network.
Parking space is simply the provision for the storage of vehicles. Car parks can be provided in a variety of land uses ranging from residential to shopping centers. Furthermore, car park can cause a serious impact on aesthetics whether it is on street, or in multi-storey aboveground or underground structures. These car parks consume both land and resources, that might be put to better usage in other areas, for instance, building another development or private homes.
A strategic approach to parking would connect the separate decisions of parking provision at individual sites with the achievement of wider planning goals. For instance, saving the land for other usage. A poor planning in car park would result in jams, bad traffic management and causing overspill at the surrounding areas. This is avoidable only if appropriate planning process is in placed, it helps to determine the future parking arrangement associated hence, preventing it to cause unnecessary headaches for the drivers. The main concern of planning parking activity will take note of the ways land and natural environments are conserved, valued, developed or organized using geographical understanding.
Data mining is the computational process of discovering patterns in large datasets, also known as “big data”. Whereas, for our project, the data collected are in time-series format. And time-series data is considered to be multidimensional data, as there is one observation per time unit and each time unit represents a dimension.
Parking utilization provides a time-series of typical parking demand for the development in that area that parking day. Thus, by comparing parking utilization comprehensively, the study will be able to clearly identify patterns and trends of those high and low usage car parks.
Hence, this paper seeks to explore using time-series data mining techniques to discover patterns and trends of similar car park sites within 29 shopping retail malls.
INTRODUCTION
Parking requirements are the exclusive domain of local government and it is subjected to their concerns. Minimally parking requirements include four important elements, (1) the land use for the parking, (2) the car park ratio with regard to the size of the development, (3) taking into consideration of the demand and supply for the car park lots and (4) the car parks surrounding will also influence the demand required (Marsden, 2006).
Cities created off-street parking to ensure that new developments have sufficient space and ample parking (Barter, 2010). A lack of parking will result in generating traffic congestion and causing car to park and spill over to the surrounding areas. Therefore, car park planners and public officials must be able to accurately estimate the number of parking lots required in an amenities to eliminate these parking issues (Bartner, 2010).
In Singapore, roads today already take up 12% of its total land area and with the limited land available. Singapore cannot afford to exhaust its land area by building more roads to accommodate vehicles and further expand the road network.
With the increase of Singapore population in the recent years, the scarcity must be allotted wisely. As Singapore continues to grow as a city, there is a need to increase the supply for housing, industrial and office estate. Therefore, it is not a realistic plan for every Singaporean household to own a car (LTA, 2012).
Having said that, car is not a basic necessity in Singapore since public transportation is well developed and easily accessible. However, Singaporeans seem to think otherwise as the number of households in Singapore that own a car increased to 45% in 2013 from 40% in 2008. In order to curb the amount of car ownership and to ensure the roads is smooth flowing and congestion-free, the authority affirmed that it would continue to emphasize the vehicle ownership and usage restraint measure.
Since 1990, the Certificate Of Entitlement (COE) system has enabled Singapore to exercise effective control of vehicle population growth. As Singapore becomes more urbanized, the social cost of car ownership will also increase. This is because land has to be set aside for parking spaces at not only where we reside, but also at the places where we work, study and play. Allocating more land for car parks means that there is less land for other developments, such as housing, schools or healthcare facilities. On top of that, illegal parking and congestion in local neighborhoods may also become more prevalent.
With these considerations in mind, the authority would like to understand the car park occupancy situation in Singapore. Thus, the authority has requested a consultancy firm to find out more through site survey and observation in theses car parks. The information collected is transformed into knowledge with the help of the team assisting the consultancy firm in producing detailed reports, info-graphics and consolidated data for each car park sites to summarize the findings. This information is crucial to authority, as it will help it to better forward plan and handle the car park issues in Singapore.
Apart on assisting the consultancy firm in report the independent car park site situation, the team will explore and demonstrate the effective use of time-series data mining in analyzing complex data. This research study will help the authority to discover new insights on several clusters of shopping malls that are grouped together based on their similar characteristics through utilizing the car park occupancy.
Car Park Sites
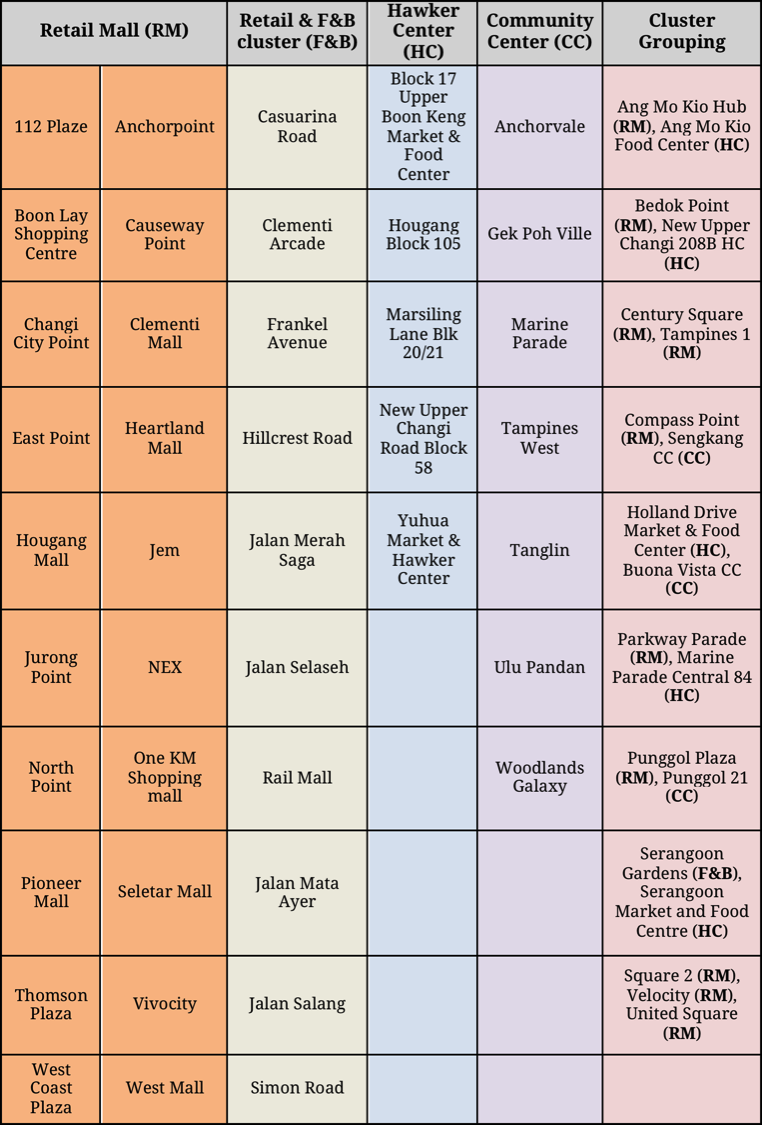
The consultancy firm had completed the data collection process and compiled the results. Its primary focus is to work on the analysis and to report the findings of the 65 car park sites. Additionally, they had also created clusters by grouping the nearby car park sites together. For instance, the car parks of Punggol Plaza and Punggol 21 CC are grouped together, as they are geographically located next to each other.
The allocation of the reports required for all of these car park sites are as shown below:
As of the initial meeting on 30th December 2015, the consultancy firm had completed and submitted 10 reports to the authority. Hence, there are 45 outstanding reports, info-graphics and excel files need to be worked on. the consultancy firm’s submission deadline for the reports is 31st January 2016. Therefore, the team’s initial job scope is to assist the team in the consultancy firm in meeting its submission deadline.
After the completion of phase 1, the team will further process the data collected to coming up with new insights. Additional initiatives will include the comparison of the different car park sites, as well as, a national average representation. This will allow the business owner, to better understand the situation nationwide rather than looking at each car park site’s situation independently. Additionally, the team will also conduct a focus study using time-series clustering on shopping mall car park sites. The team would like to explore and demonstrate with the use of time-series analysis to group similar characteristics shopping mall car park sites together based on their car park occupancy. And lastly, sharing the findings and evaluate the accuracy of the analysis by linking back to the real world.
Project Objective And Business Problem
The objective of this project is to assist a consultancy firm in understanding the current parking situations in 65 different locations in Singapore. These 65 parking locations compromise of 30 retail malls, 15 retails and Food & Beverage (F&B) clusters in landed housing estates, 10 hawker centers, and 10 community clubs.
The study was conducted previously by the consultancy firm through parking occupancy surveys, human traffic counts, and interview survey at selected locations at stipulated times. The collected data will then be further processed before submitting it to the authority to understand the current parking situation at these locations. The team will be splitting the project into two phases to complete.
For phase 1, the team will be assisting the consultancy firm to analyze each car park site situation. Each parking site result collected is tabulated into a single Microsoft Excel spreadsheet file according to each survey type. Using the excel spreadsheet, it will help to generate charts and graphs for the info-graphics. Finally, a final report will share the findings of each parking site. It includes a write-up of the characteristics and methodology of the entire process, all location maps and captured images (if any). Lastly, the final report will be structured as per the format shown below:
1. Executive Summary
2. Site Background
3. Site Characteristics
4. Site Assessment
5. Survey Deployment Plan
6. Survey Findings
7. Conclusion
8. Appendices
8.1 Site Map of the parking locations
8.2 Car park characteristics
8.3 Pre Survey Observations & Results
8.4 Info-graphic to summarize the results collected
8.5 Survey Questionnaire Template
LITERATURE REVIEW
Parking Policy
One of the most important links between land-use and transport is parking policy. The effectiveness of parking policies are often compromised due to the perceived tension among three of the objectives that parking supports: regeneration, restraint and revenue. In particular, the belief that parking restraint measures could potentially damage the attractiveness of city centers in both retail and commercial enterprises and this limits the political acceptability of pricing policies and planning (Strubbs, 2012).
Parking space is simply the provision for the storage of vehicles (Dolnick, 1999). Car parks can be provided in a variety of land uses ranging from residential to shopping centers. Furthermore, car park can cause a serious impact on aesthetics whether it is on street, or in multi-storey aboveground or underground structures. These car parks consume both land and resources, that might be put to better usage in other areas, for instance, building another development or private homes.
A strategic approach to parking would connect the separate decisions of parking provision at individual sites with the achievement of wider planning goals. For instance, saving the land for other usage (March, 2007). A poor planning in car park would result in jams, bad traffic management and causing overspill at the surrounding areas. This is avoidable only if appropriate planning process is in placed, it helps to determine the future parking arrangement associated hence, preventing it to cause unnecessary headaches for the drivers. The main concern of planning parking activity will take note of the ways land and natural environments are conserved, valued, developed or organized using geographical understanding (Aldridge et. al, 2006).
In order to achieve desirable arrangements on land use for car park, planning is essential and must establish through reiterate rules, goals, standards, designs and decision systems. In this sense, there is need for us to examine existing understanding on parking issues, as the first step to re-consider the manner in which collective action might be taken on the basis of this knowledge. Usually, these information are in the form of spatio-temporal characteristics, hence, data mining techniques are applied in order to explore the insights of car park overspill pattern.
Time-Series Data mining
Data mining is the computational process of discovering patterns in large datasets, also known as “big data”. Conventional data mining is also known as Knowledge Discovery in Database (KDD). The objective of KDD process is to extract information and transform it into knowledge, an understandable structure for future use by the business users (Frawley et. al, 1992). There are three main types of data mining techniques, which are the association rules, classification and statistical. Association rule is used to discover relations between variables in a large dataset. Classification is a data mining function that helps to generate a set of rules for classifying instances into predefined classes. Lastly, statistical data mining is driven by the data to discover new patterns and build predictive models. Although these conventional data mining techniques are broadly used by many industries, they are not appropriate for performing data mining on time-series data. Hence, another set of data mining techniques is developed to cater for time-series data, which is time series data mining (Fuller, 1995).
Time-series data mining has four major tasks: clustering, indexing, classification and segmentation (Harvey, 1994). Firstly, clustering helps to find various time-series data of the similar patterns and grouping them together. Next, indexing finds other similar time series data in order, given in a query series. Thirdly, classification assigns each time series to a known category by using the trained model that was established earlier. And lastly, segmentation separate and partitions the time series. Time-series data is considered to be multidimensional data, as there is one observation per time unit and each time unit represents a dimension. In the real world, each time series data is usually highly dimensional (Lee et. al, 2014). For instance, in a stock market setting, the data which the prices change over time can be recorded every second. In the other words, it will accumulate to be 3,600 records an hour and 86,400 records a day.
Through the collection of data on a routine basis, organizations are amassing sequentially order data. Observation and records in such dataset possess a time element in it. Accordingly, these information are collected over a period of time (i.e. over a day, a week or even up to a decade). Examples of such data types include Sales transaction, delivery orders, traffic information and etc. Over the years, businesses and organizations increasingly start to realize the importance and valuable of these data. They seek to analyze these time-series data to discover more business insights to help them improve and grow.
While presenting the data, data analyst has to put in the extra effort of transforming these high-dimensional data from time-stamped transaction into a table that is suitable for time-series application. This will help applications to identify these data as time-series data and perform further analysis and pattern detection on theses data. Data analyst has to ensure that the time-series data is transformed into a set of contiguous time instance, whereas, previously it is used to be univariate or multivariate data type.
One of the common mistakes in analyzing time-series data is that the time-stamped data is irregularly recorded, this will result in two different time-series data has been identified to have the common trends (Esling & Argon, 2012). In the case of two time-series did not occur concurrently, the application of time-series data mining techniques would not be able to discern the relationship, as time is no longer a factor in that comparison.
For example, based on the two figures shown above, Fig 1a represents the traditional data mining similarity measure using Euclidean distance. It is used to compare the similarity between the two time-series Q and C, and it is shown that the relationship is not discerned as both of them are out of phase. However, in Fig 1b, using Dynamic Time Wrapping (DTW) technique, it has overcome this issu by accounting for the time factor when comparing the two different time-series.
The development of DTW algorithm helps to identify the similar treands that may occur over the time period across multiple arrays of sequenced data. This mathematical formal serves very well as an effective data mining technique when algorithmically comparing the different sets of time-ordered data. DTW has offered a better means of identifying similar trends across sets of sequenced records and observations.
Hence, this paper seeks to explore these time-series data mining techniques to discover patterns and trends of similar car park sites within 29 shopping retail malls.
TOOLS & TECHNOLOGY
Analysis & Visualization Tools
The team will be use 4 tools for analysis and visualization, (1) Microsoft Excel, (2) SAS Enterprise Miner, (3) Microsoft SQL Server Integration Services (SSIS) and (4) JMP Pro.
Microsoft Excel is a spreadsheet application that is designed for calculation, graphing charts and visual aids, and pivot tables. In this case, the team will be using it to analyze the data for phase 1, generating charts and calculation for each car park sites.
SAS Enterprise Miner is analytical software that helps to streamline and simplify the data mining process. This will allow the easy retrieval of the datasets and perform analysis. Additionally, SAS Enterprise Miner allows user to perform descriptive, predictive and time-series analysis on huge amount of data. The software also has interactive visualization function and ease-to-use user interface that help to perform most of the task by drag and drop functionality.
Microsoft SQL Server Integration Services (SSIS) is a platform for building enterprise-level data integration and data transformations solutions. Integration services will allow user to extract, transform the data and load it onto the database.
JMP Pro is the advanced version of JMP, it is created for users who need sophisticated modeling techniques. JMP Pro is a statistical analysis software from SAS that provides a platform for interactive data visualization, exploration, analysis and communication.
For this project, the team will be using these analytical tools to gather and discover new insights of the car park overspill patterns.
Reporting Tools
Apart from analysis and visualization tools, the team will be using 2 software for reporting, namely (1) Microsoft Word, a word processor software, and (2) Microsoft PowerPoint, a slideshow presentation software.
Collaboration tools
Lastly, the team are using (1) Dropbox, file hosting services, (2) Google Drive, cloud storage web application and (3) SMU Wikipedia, a SMU encyclopedia web page that is built for collaborations, to collaborate within the team and external stakeholders too.
DATA COLLECTION AND DATASETS
Data Collection
The traffic planners’ objective is to review the current parking situation in 4 different types of developments in 65 different locations (30 RM, 15 F&B, 10 HC and 10 CC). Due to the different nature of each premise, different methods are used to gather the count data of the vehicles and patrons. Additionally, intercept survey was also carried out to gather sample data. In an extremely access point, automated counters were deployed to assist the count process. The entire data collection process occurred between May 2015 and October 2015.
Each dataset contains the vehicle count and human count of the particular premises. For instance, in the Retail Mall settings, there were a handful of enumerators deployed at the entrance point and the exit point of the building as well as the car park. These enumerators were deployed in pairs or trios. There was a pair of enumerators that was in-charged of counting the number of people entering and exiting the building. One of them was in-charged of counting the inbound traffic of people entering the building while the other counting the outbound of human traffic exiting the building. Then, a trio of enumerators was deployed to count the vehicles (motorcycles included). One of them was assigned to count the number of vehicles inbound into the premises and also the passenger(s) on-board, the other was in-charged of counting the outbound vehicles and passenger(s) on-board exiting the premises and the last enumerator was in-charged of finding out the overspill demand through counting the number of vehicles queuing to enter the car park and observing and noting down the number of vehicles parking or waiting illegally along the side streets. The same data collection process was done for both the Community Centers settings and Retails and F&B clusters.
However, for the Hawker Centers, the trio enumerators that were counting the vehicles entering and exiting goes through the same process as mentioned in the previous paragraph. The pair of enumerators that was in-charged of the human count patrolled the Hawker Centers instead of stationing at the entrance or exit point. One of them was assigned to count the number of seated patrons while the other counted the number of patrons queuing at the stalls. The enumerators made their rounds every 15 minutes to count the human occupancy of the Hawker Centers.
These data were collected between 10am to 9pm. Each data was recorded in blocks of 15 minutes timeframe. In the other words, between the periods of an hour, there would be 4 records (12pm, 12.15pm, 12.30pm and 12.45pm) being documented. Lastly, the data collection process for each car park site locations lasted for two days; one on a weekday (non-peak day) and one on a weekend (peak day).
Last but no least, a dedicated team of people were deployed on the ground carrying out intercept survey, interviewing patrons and collecting survey results. All these information are been compiled into a single spreadsheet for the core project team members to analyze before they report their findings to the authority.
Datasets
Pre-Survey Report
Pre-surveys reports are used to collate each site’s information, such as its unique characteristics and assess eligibility. This will allow us to better understand the surrounding of that particular premise and the nature of business and uniqueness of that premise. Hence, helping us to determine the most appropriate survey methodologies to achieve the results.
Human Count
The enumerators will count the total number of patrons and passenger(s) on board of the vehicle. Thus, with this information, we will be able to determine the total number of human entering the premises in that particular time.
Vehicle Count
Likewise for the total vehicle count, the results gathered from the enumerators show the number of inbound and outbound vehicle, roadside parking and overspill count.
Interview Survey
As for the interview survey, demographic profile and the travel behavior are recorded. Demographic profiles capture the citizenship, gender, age and ethnicity of the patrons whereas the travel behavior survey takes note of the number of patrons visiting the amenities that particular day, their frequency of visit, the main purpose of visitation, duration of visit, their form of commute to the premise that day and their companion for their trip there. Additionally, for drivers, they will need to input in more information such as their vehicle parking place, the reason for parking there, as well as their accessibility from where they parked to the amenities they are visiting on that particular day.
PHASE 1 ANALYSIS METHODOLOGY
Phase 1 (Jan 2016)
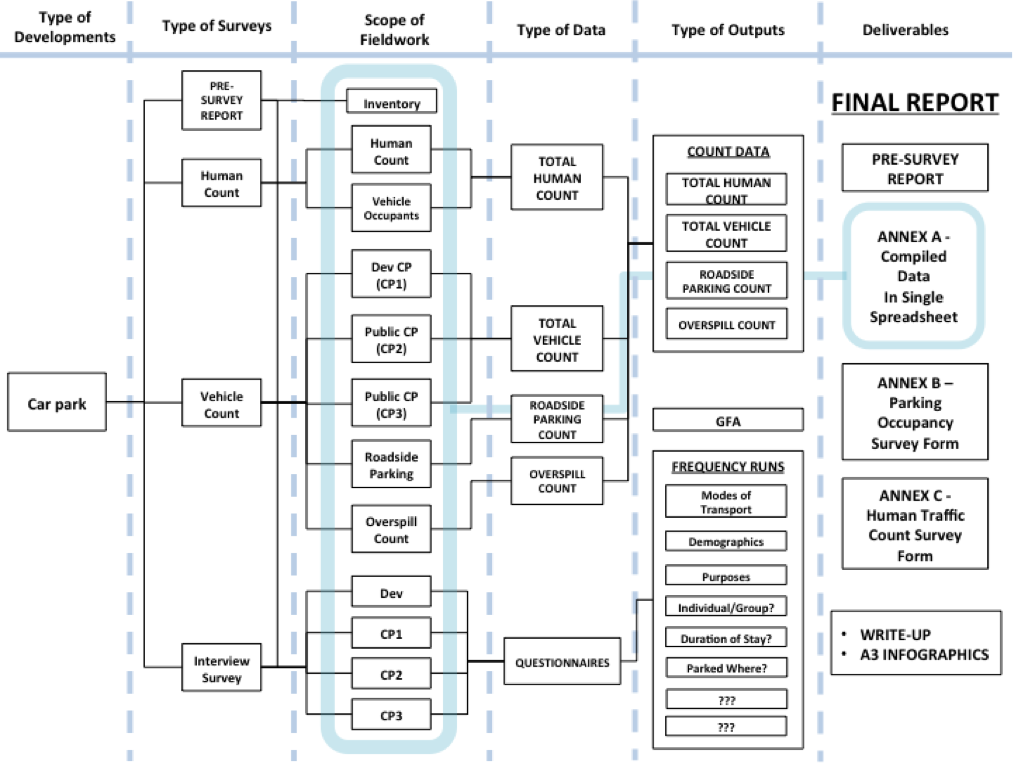
In order to gain insights from the current parking situation at these 65 selected location, we have to gather all the information collected previously and further process the information. The 4 key components, as mentioned in the previous section, are Pre-Survey Report, Human Count, Vehicle count and Interview Survey.
An illustration of the analytics methodology is as shown below:
Hence, with that, we will be able to derive both the qualitative and quantitative results findings. Qualitative results help us to gain an understanding of the underlying reasons, motivations and behavioral for visiting the premise. Results from survey questionnaires are considered qualitative results findings. On the other hand, quantitative results are facts and figures that quantify data and generalize results from a sample population. As such, the total number of human count, vehicle count, roadside parking count and overspill count are considered quantitative findings.
With the analysis from both the qualitative and quantitative figures, we will be able to draw insights from the current parking situations in that particular car park. Therefore, a report and info-graphics will be created to complement the key findings in each particular parking sites. The team will be using Microsoft Excel to work on the analysis and findings and using other tools like Microsoft Word and Microsoft PowerPoint to create the final report and info-graphics.
Phase 1 Deliverables
Thus far, the team has completed phase 1 of the project in January, which is to assist the consultancy firm to understand the car park issues in 6 development sites (AMK hub, AMK hawker centre, Compass Point, Jalan Salang F&B cluster, Rail Mall F&B cluster and Sengkang CC). As mentioned earlier, the consultancy firm has categorized AMK hub and AMK hawker centre to be grouped together, due to the distance between the two sites is pretty nearby to each other. Likewise for Compass Point and Sengkang CC to be grouped together to form Sengkang Cluster. As for the deliverables for phase 1, the team has analyzed and completed these deliverables for the consultancy firm:
Excel files
1. AMK Hub.xlsx (7 spreadsheets) 2. AMK Hawker Centre.xlsx (7 spreadsheets) 3. Compass Point.xlsx (7 spreadsheets) 4. Sengkang CC.xlsx (7 spreadsheets) 5. Rail Mall.xlsx (7 spreadsheets) 6. Jalan Salang.xlsx (7 spreadsheets)
Reports
1. AMK Cluster.pdf (82 pages) 2. SengKang.pdf (99 pages) 3. Rail Mall.pdf (87 pages) 4. Jalan Salang.pdf (62 pages)
Info-graphics files
1. AMK Hub.pdf (7 informative poster images) 2. AMK Hawker Centre.pdf (8 informative poster images) 3. Compass Point.pdf (8 informative poster images) 4. Sengkang CC.pdf (9 informative poster images) 5. Rail Mall.pdf (11 informative poster images) 6. Jalan Salang.pdf (11 informative poster images)
The excel files are processed to assist in analyzing and plotting out the charts for the info-graphics. The reports are generated to share and report the insights found in the development. Lastly, the info-graphics documents are prepared to capture and share the main insights from the respective sites.
Phase 1 General Findings
It is concluded that residents living within the region mainly patronize the development cluster. The human traffic profiles show patrons on those development sites to be more often visited during the late afternoon to evening periods, which coincide with after school hours and the start times of classes, activities held at the cluster and dinner peak period. Most of the observation gathered is that there are no distinct anomalies to suggest patronage of other purposes, i.e. famous food stalls, mall being a popular shopping location for out-of-towners.
In general, weekday and weekend parking demand appeared to be similar in the traffic flow pattern during the lunch hour whereas the weekend saw a spike during the dinnertime. For the retail malls, parking occupancy findings show that parking supply for the cluster to be sufficient for the current demand and there is spare capacity in the public car parks, which are within 5 minutes’ walk to the development cluster, to handle overspill parking if the situation does occur.
However, for the F&B clusters, the local residents staying in the landed properties dominate
roadside parking along the surveyed roads. While it was evident that the illegal parking was partly contributed by the patrons visiting the development, it was also observed by the Site Supervisor that residents contributed their fair share of the illegally parked vehicles as some of the cars were parked for throughout the survey hours.
The team felt that the one-day survey for a weekday and a weekend provided has limited insight into the traffic patterns and trends of a particular development.
Lastly, the team also felt that the survey results are too focused on individual sites, therefore, there is a need to draw more insights on the similarity of the car parks. And this will be done in phase 2 of the project.
PHASE 2 ANALYTICS METHODOLOGY
Phase 2 (Feb 2016 – Apr 2016)
We will be utilizing the raw data provided by the consultancy firm to do more in depth analysis than what was required in Phase 1 of the project. Phase 1 did more of a summary of each parking site individually. In phase 2 we proposed time series data mining in order to identify and analyze any patterns that might exist between different parking sites, for example perhaps there might be a similarity between a retail mall in the east and west that might not be obvious from a superficial view of the data. Time series dating mining allows us to represent a collection of data that is obtained over a period of time, which allows us to view the shape of the data over time. With that, the team will do a further analysis based on the site characteristic of the different clusters.
The team would extend the scope of work of the project to include comparison with other car park sites in phase 2. For instance, comparing the car park occupancy of AMK hub (Retail Mall) with NEX (Retail Mall) on weekend. The purpose of this feature will allow the business users to better appreciate the data collected previously and also gain new insights that can be used as a reference in refining its future planning provisions. In order to do this, the team will be using SAS Enterprise Miner programming language to create the visualization for this analysis.
Data Cleaning and Explorations
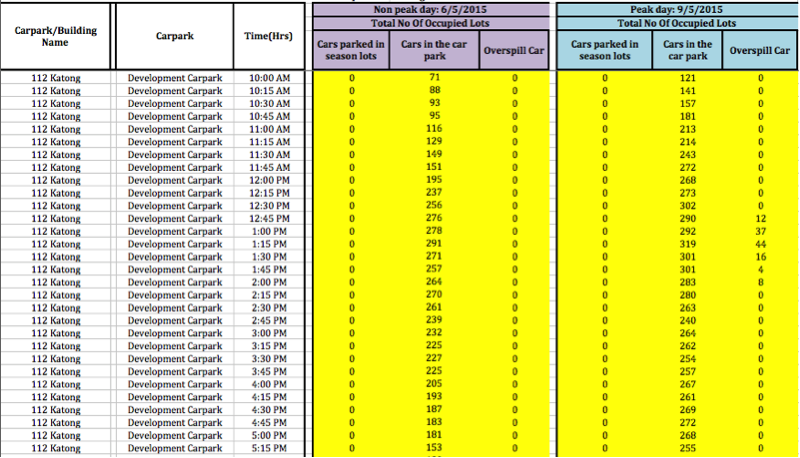
The data we received from the consultancy firm was site based and split up into individual excel files with a lot of unnecessary data.
Above figure shows a screenshot of the sample data collected. Firstly, the data will display some details on the carpark, time, and the peak day and non-peak day data recorded in accordance to the time. Weekend is represented to be peak day (i.e Saturday and Sunday) and weekday is represented to be a non-peak day (i.e Monday, Tuesday, Wednesday, Thursday and Friday). Each record is captured every 15 minutes, which will include the details of the number of cars in season lots, the number of the cars in the carpark and any overspill car observed.
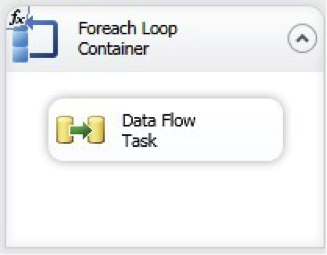
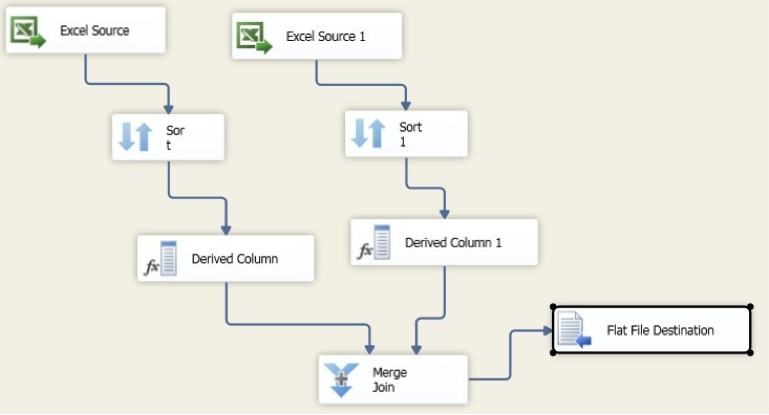
After some elementary analysis, we realised there is a need to transform the time-based data into appropriately time stamped time series data in order to perform further analysis. For our group we utilized SQL Server Integration Services 2010 to look through all excel files and extract relevant data, as we were comfortable using this software from previous projects.
Filtering and extracting data
There were many variables in the excel sheet that was not helpful for our phase 2 analysis. We have decided on using 6 target variables for our analysis, which are the most relevant to what we would like to analyze. The variables are peak_occupancy, non_peak_occupancy, peak_car_in, non_peak_car_in, peak_car_out, non_peak_car_out. We also filtered out 112 Katong as it was a pilot site and there were many missing data.
Combining Data
As the data we received from the consultancy firm was site based and split up into individual excel files, there is a need for us to combine all the sites together after filtering and extracting data from individual excel files. This file, includes attributes such as time, car_park (cross id), total_lots, peak_occupancy, non_peak_occupancy, peak_car_in, non_peak_car_in, peak_car_out, non_peak_car_out. There are a total of 28 sites that we plan to carry out our analysis.
Recoding Time
As the time given was in ##:##AM/PM format, there was a need for us to recode it into numbers in order for us to run Time Series Analysis on SAS Enterprise Miner. We used SAS Enterprise Guide to recode our time to Time ID starting from 1 before loading the cleaned data into SAS Server.
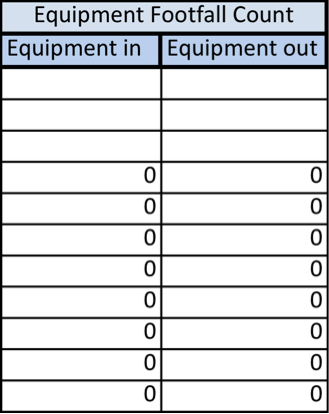
Figure above shows that there are unnecessary rows and columns of data as they are empty. Figure below shows that the recoded data after cleaning has been done.
Data Dictionary
Time: Timeslot ID number
Car_Park: Name of the development car park
Total_Lots: Total number of lots available in the development car park
Peak_Occupancy: Numbers of cars inside the car park during peak day
Non_Peak_Occupancy: Numbers of cars inside the car park during non-peak day
Peak_Car_In: Number of cars going into the car park on a peak day
Non_Peak_Car_In: Number of cars going into the car park on a non-peak day
Peak_Car_Out: Number of cars going out of the car park on a peak day
Non_Peak_Car_Out: Number of cars going out of the car park on a non-peak day
Variable used for the study
Parking utilization provides a time-series of typical parking demand for the development in that area that parking day (Moskovitz & Wheeler, 2011). By comparing parking utilization comprehensively, the study will be able to clearly identify patterns and trends of those high and low usage car parks. Additionally, the study will be able to assess how much supply of the parking is utilized throughout the day.
Various studies have suggested the used of occupancy as a form of measure for the study (Chen, 2014 and Soler, 2015). As parking occupancy suggests the numbers of cars in the development car park at that point of time. Furthermore, it helps us to understand the utilization of the car park. Development car parks follow a concrete temporal patterns or periodic behavior, hence, data mining modeling techniques methods will be able to realize these patterns (Soler, 2015).
As briefly mentioned, the team has collected the occupancy data for both weekday and weekend for 29 shopping centers car parks. These data are recorded periodically on every 15 minutes interval for 11 hours, 10am to 9pm. Data collection is captured for 2 days (1 weekday [off-peak day] and 1 weekend [peak day]) between May 2015 and October 2015. Hence, with these data, the team will be able to examine and understand the car park issue using time-series data mining. The team will be building models through the usage of occupancy_peak variable. As occupancy_peak suggests the shopping center car parks situation during a peak day (weekend).
EXPLORATORY DATA ANALYSIS
SAS Workflow
The SAS Enterprise Miner workflow that our team implemented consisted of 2 main steps, namely Time-Series (TS) Data Preparation and TS Similarity nodes.
The TS Data Preparation Node is used mainly to transform the dataset into a readable format that is recognized by the program to time-stamp format in order to further run the TS Similarity node. Additionally the results of the TS Data Preparation node allow the user to analyze the output of the time series data set based on summary statistics.
TS Data Preparation
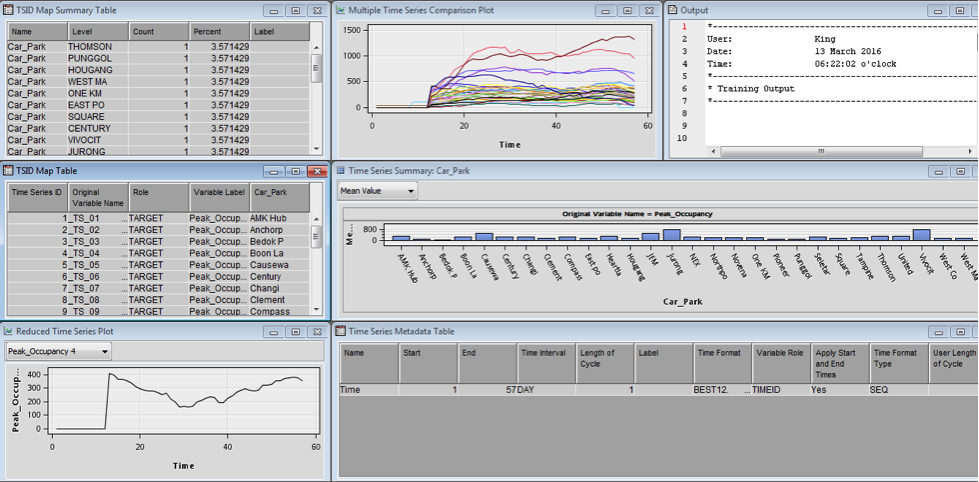
Multiple Time Series Comparison Plot
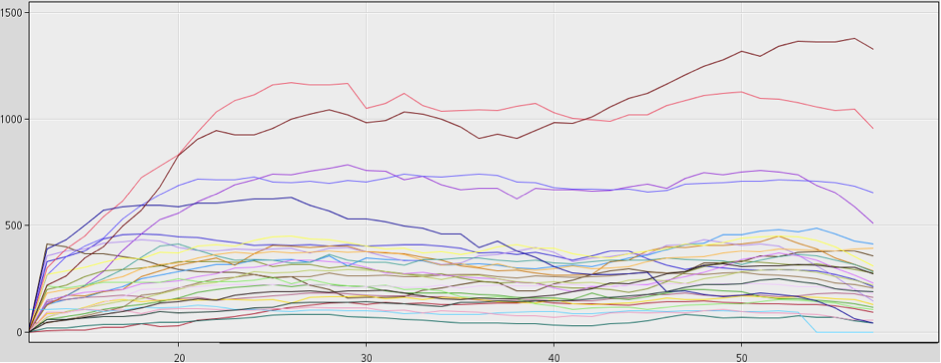
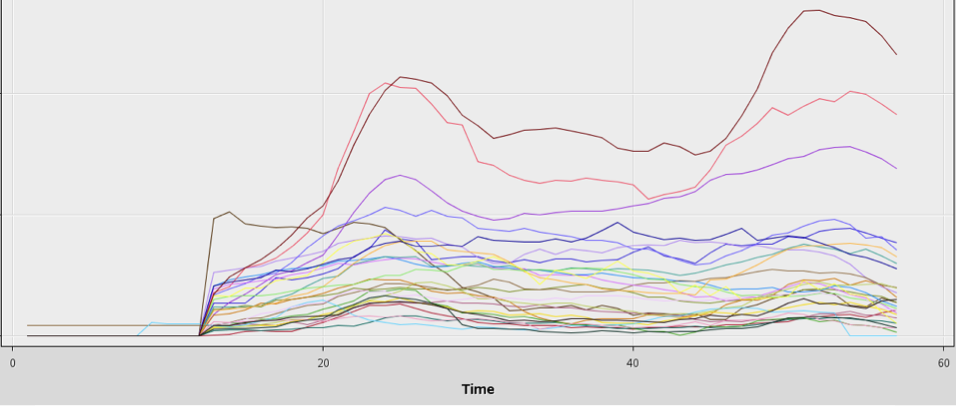
Represents time-series graph based on multiple car parks.
TSID Map Table
Shows the original dataset with the time series variable plot by CrossID variable has been transpose and converted into 28 time series with 28 unique variables. In the table, each time-series is named TS_n where n is the value of the TSID created for the time-series.
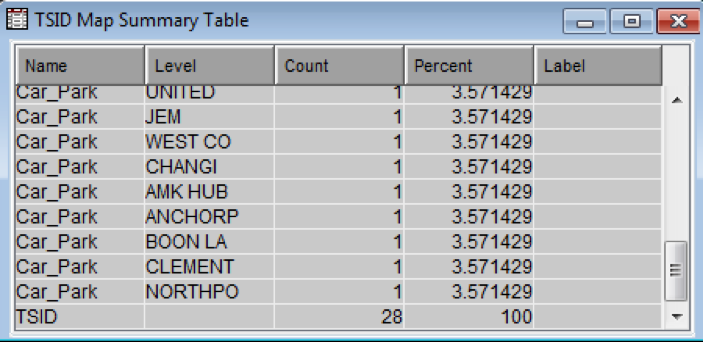
TSIP Map Summary Table
Shows the level, count, and frequency and percentage information for the CrossID and TSID variables. There is a total of 28-development car park for input and target variables, which resulted in a unique combination of 28 TSIDs.
Time Series Metadata Table
Shows the occupancy input data that uses Time as the TimeID variable to analyze data from interval of 1 to 57, which consists of data from 1000hrs to 2100hrs.
Time Series Plot
Represents time-series graph based on a particular car park.
Time Series Summary
Show distribution of the occupancy for each car park in a form of bar graphs, which includes max, mean, min and sum.
Time Series Similarity (TSS)
Allows us to analyze similarities between different time series grouped by clusters. Dynamic Time Warping algorithm is applied in Enterprise Miner to match the different lengths of similar time series in one group.
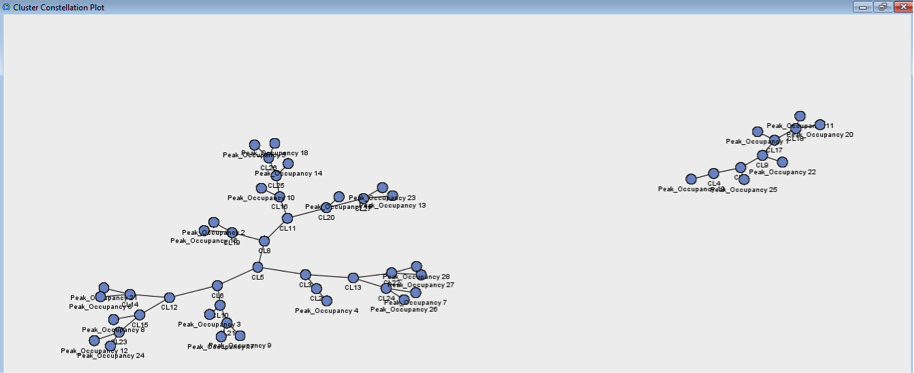
Cluster Constellation Plot
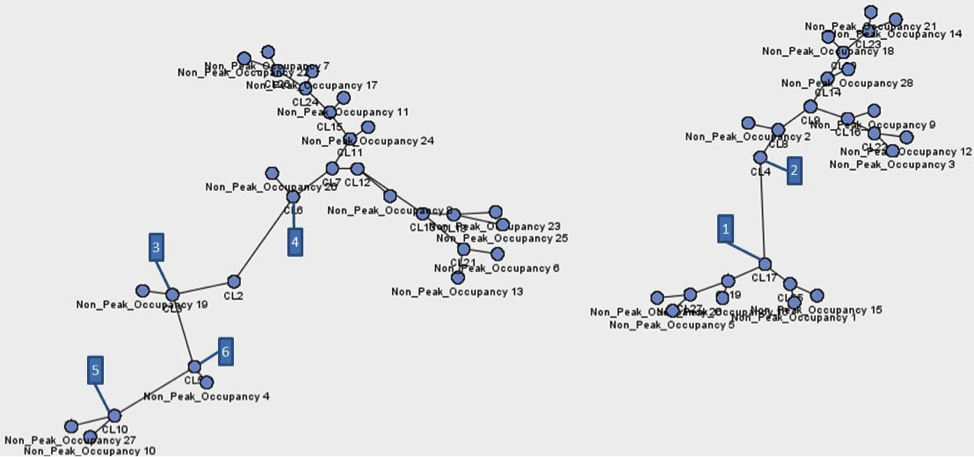
Shows simple view of the identified clusters.
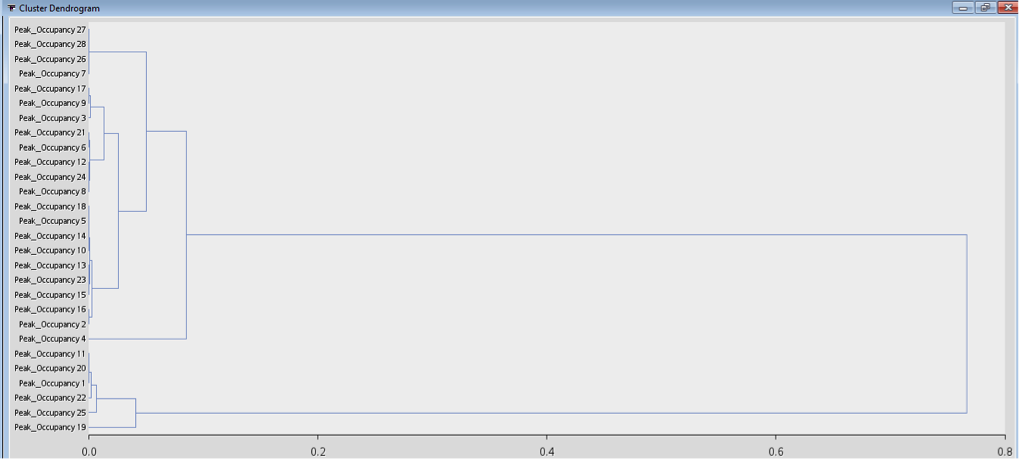
Cluster Dendrogram
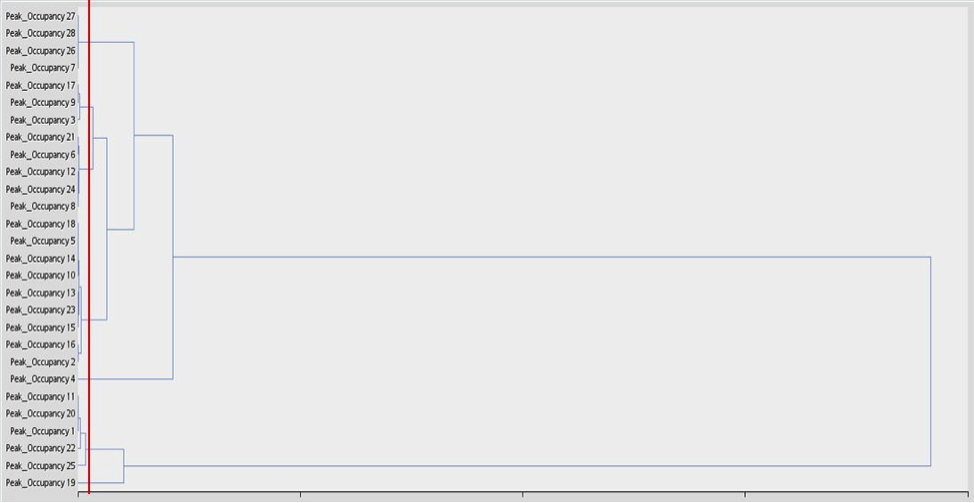
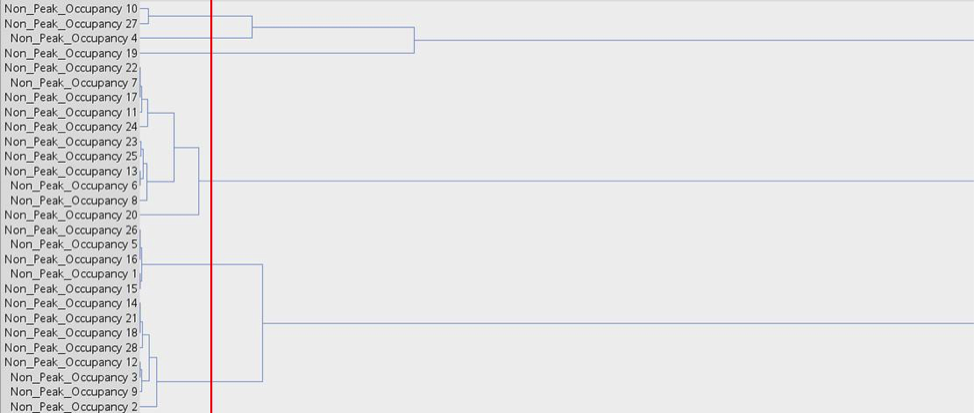
A tree hierarchy displays the steps and how the clusters are actually formed.
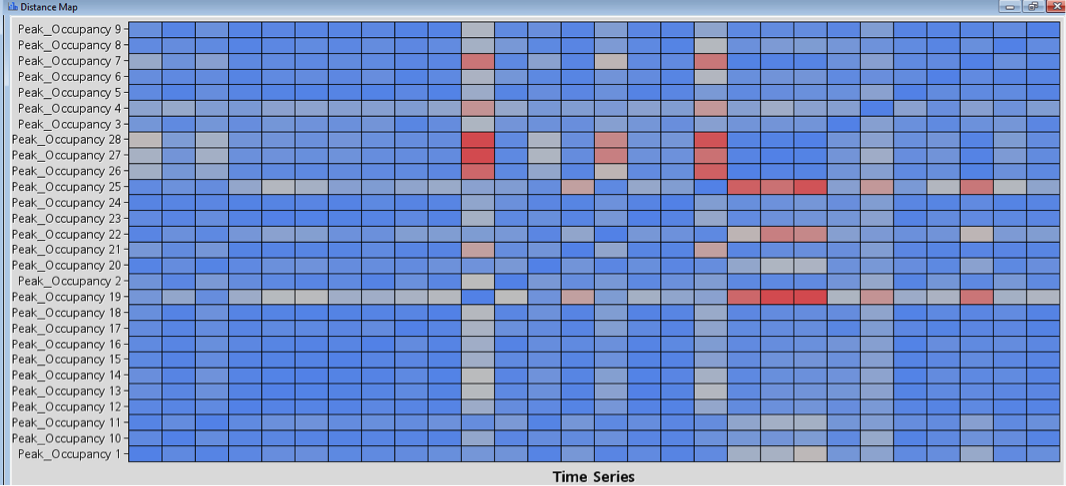
Distance Map
Shows the time-series data that has been clustered on both axes that provides visual display of similarity between one clusters to every other clusters. Blue color indicates that it is similar and red color indicates that it is dissimilar.
Using the above workflow, we are able to get meaningful insights of occupancy patterns in each clusters group by similar time-series of car parks. Further analysis of TSDP and TSS would be discussed in the later section of Advance finding.
FINDINGS AND ANALYSIS
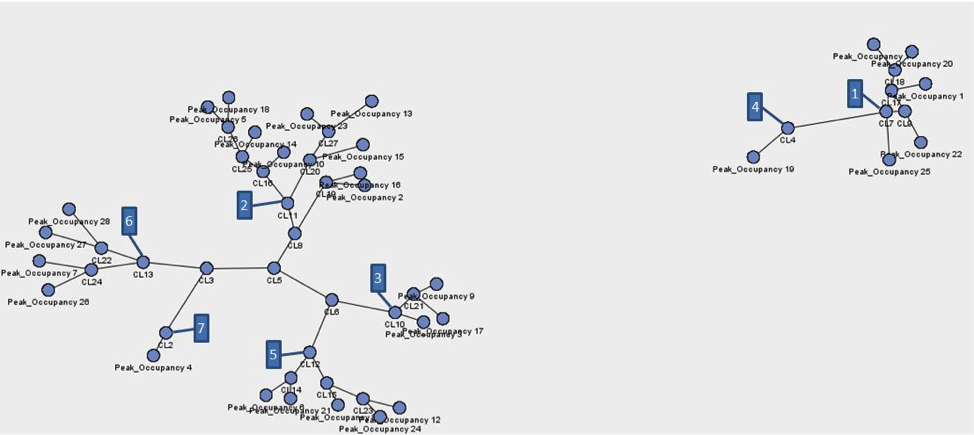
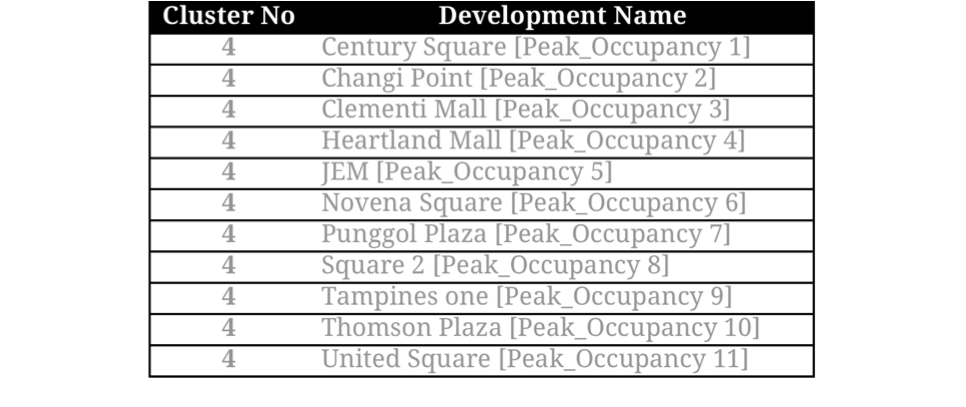
By repeating the steps taken above to load the data into the SAS server, we generated 7 smaller subsets of time series data sets from the main data set. From here our group identified the car parks that belonged to the different clusters, namely:
Peak Occupancy
Occupancy Analysis
There are a total of 7 clusters for the analysis of occupancy.
These 7 clusters were identified using the Cluster Dendrogram where very large merging of clusters is deemed as unsuitable for similarity analysis. As the diagram shows at the cut off there are no large merging of clusters before this point.
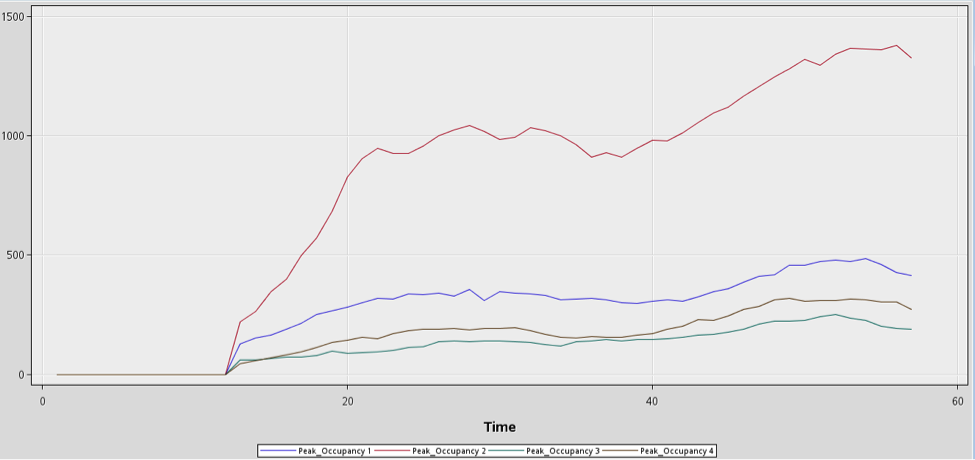
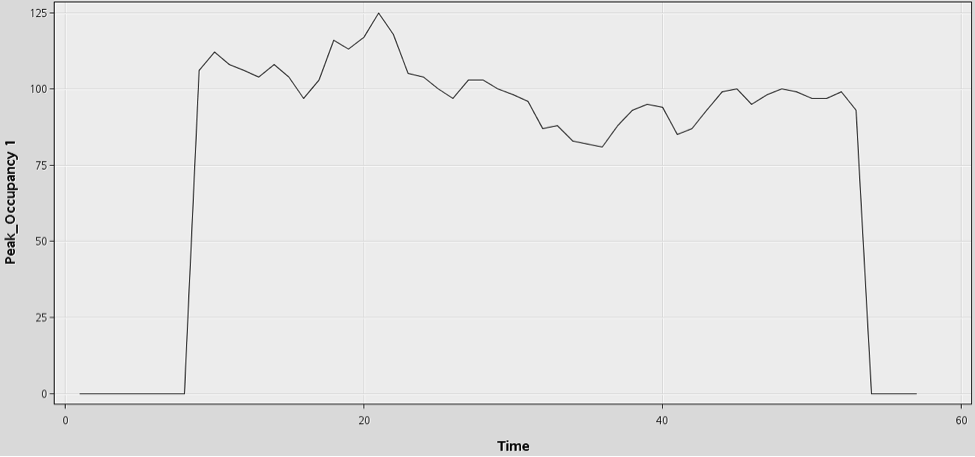
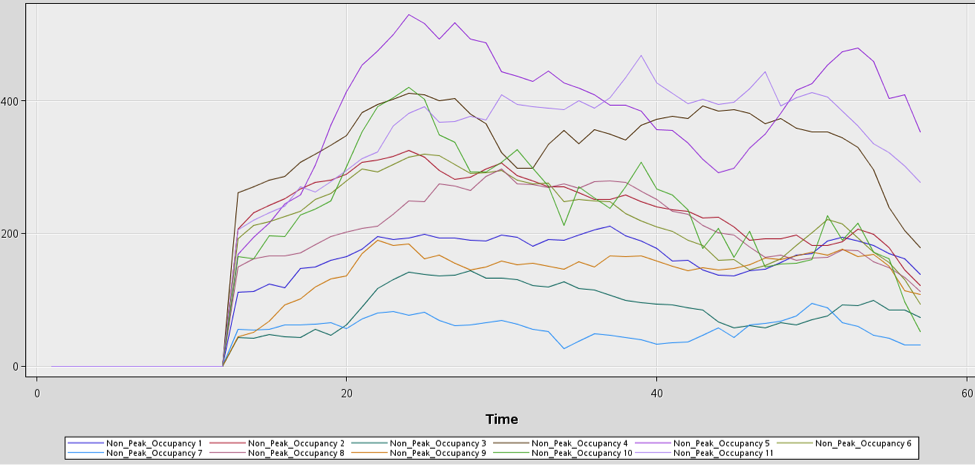
The resulting time series graphs show that there might be some similarities between the car parks, however we would not be able to identify them without any further analysis of the Time series.
Cluster 1
An interesting cluster is cluster 1, the retail malls that belong in this cluster are located within or around Ang Mo Kio, Hougang and Novena, which are very close to each other geographically.
For cluster 1, the main purpose of visit was found to be Food and beverages. For Punggol Plaza, there are many food outlets in it and there were no other choices around that area for residents to dine in. AMK Hub and Heartland Mall has got hawker centres, which are located around the development site. United Square and Square 2 are connected together with Novena Square. However, only United Sqaure and Square 2 offers a variety of food for their patrons to choose.
Cluster 2
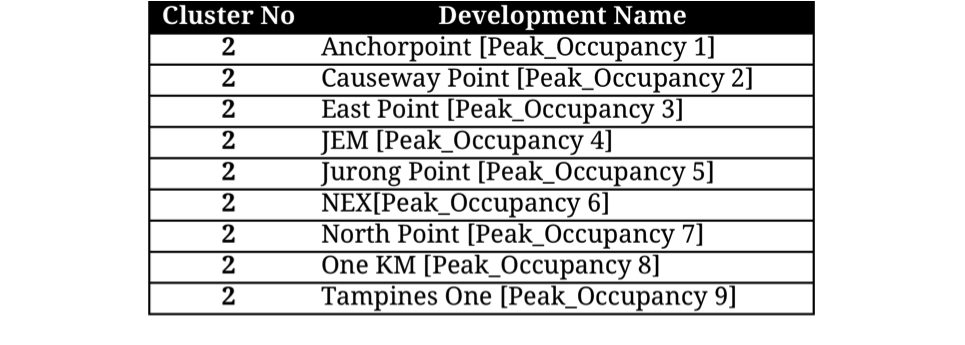
Cluster 2 consists of Anchorpoint, Causeway Point, East Point, JEM, Jurong Point, NEX, NorthPoint, One KM and Tampines One. Majority of the development sites are located near or within bus interchange and MRT stations.
For this retail mall, it is understand that it offers a wide of services, from food and beverages to shopping and retail.
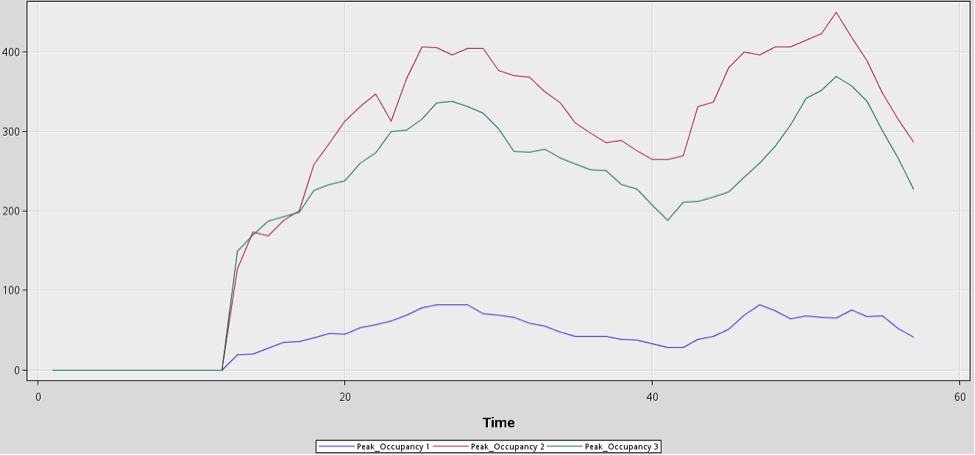
This shows that all these development sites are the concentrated areas of activities for each estate. This also explains why it has a consistently high trend of peak occupancy.
Cluster 3
Cluster 3 consists of Novena Square, Compass Point and Bedok Point. The purpose of visiting for this 3 malls were found to be mainly for shopping and F&B, with a higher percentage of shopping. It also shows that teenagers mainly visit these shopping centers as Compass Point and Bedok Point consists of tuition centres and Novena Square consists of mainly shops for sports.
Another similarity for this cluster is that, these shopping malls is integrated with MRT station.
Cluster 4
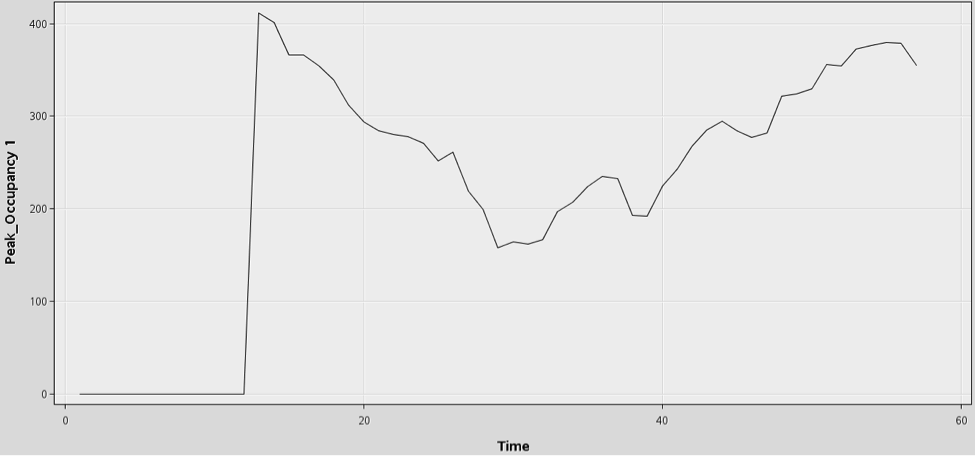
Cluster 4 consists of Boon Lay Shopping Centre. It is clustered by itself as the development site does not have a development carpark and the carpark used for analysis was an open carpark shared by multiple HDBs.
Cluster 5
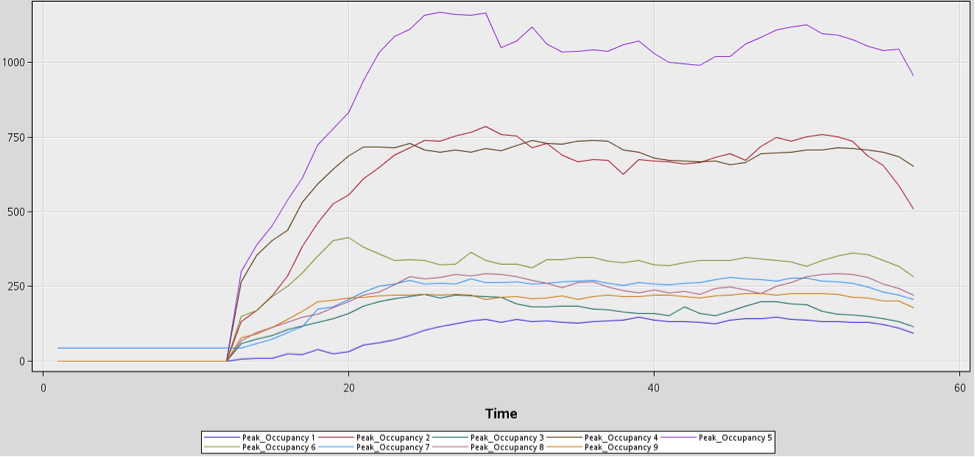
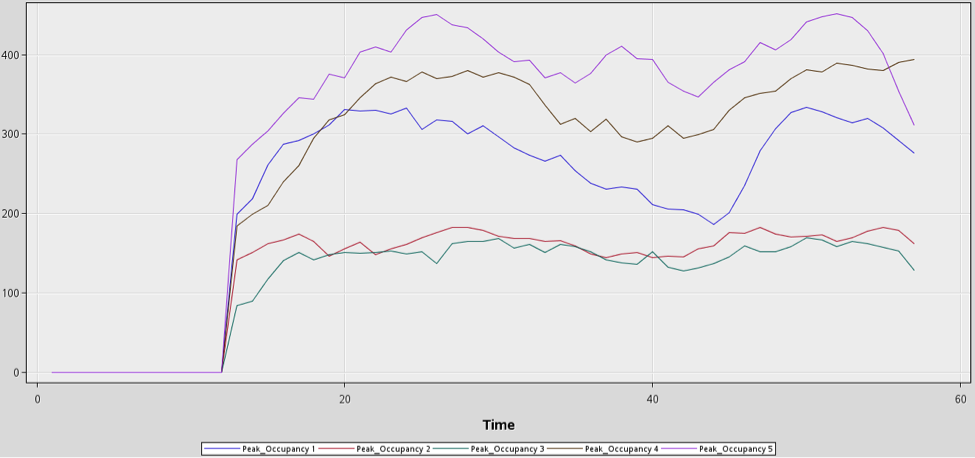
Cluster 5 consists of Century Square, Clementi Mall, Hougang Mall, Seletar Mall and Thomson Plaza. Purpose of visit for these 5 sites are very evenly spread out between shopping, F&B and supermarket. These are characteristics of heartland malls whereby patron visit these retail malls for supermarket purposes. There are consistent increasing trend from morning till afternoon for majoirty of the malls in these clusters and a sharp fall during late afternoon.
Cluster 6
Cluster 6 consists of Changi City Point, Vivo City, West Mall, and West Coast Plaza. There are churches located very near to all development sites. The peak for these clusters is in the noon and evening where services end. A possible reason for this cluster is that patrons visit this development after working hours, and they spent their dinner there before returning home.
Cluster 7
Cluster 7 consists of Pioneer Mall. It is clustered by itself as the development site does not have a development carpark and the carpark used for analysis was a multi storey carpark which is being shared with Blk 638A.
From the results we identified a few interesting similarities and insights. Boon Lay Shopping Centre and Pioneer Mall appear to be outliers, two retail malls located in the West of Singapore that are significantly different from the rest of the retail malls recorded in the data set but not similar enough to belong in the same cluster.
Off Peak Occupancy
Off Peak Occupancy Analysis
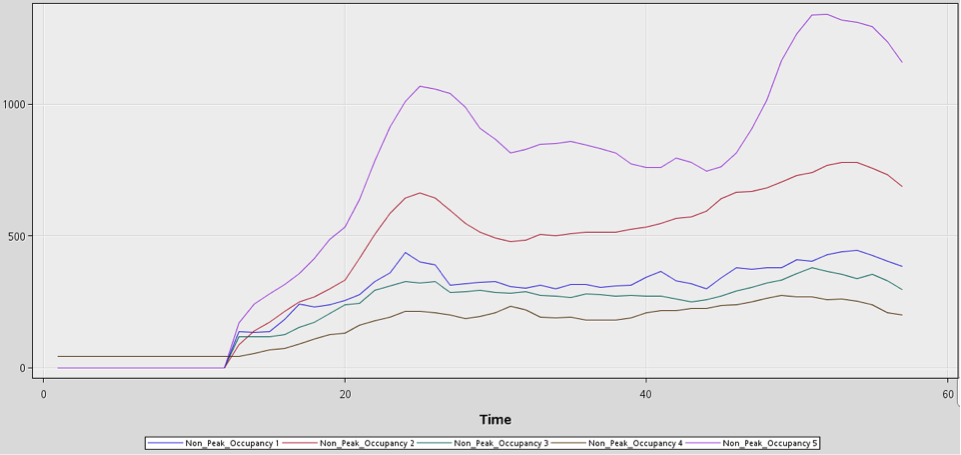
By repeating the steps taken above to load the data into the SAS server, we generated 6 smaller subsets of time series data sets from the main data set. From here our group identified the car parks that belonged to the different clusters, namely:
There are a total of 6 clusters for the analysis of occupancy.
These 6 clusters were identified using the Cluster Dendrogram where very large merging of clusters is deemed as unsuitable for similarity analysis. As the diagram shows at the cut off there are no large merging of clusters before this point.
The resulting time series graphs show that there might be some similarities between the car parks, however we would not be able to identify them without any further analysis of the Time series.
Cluster 1
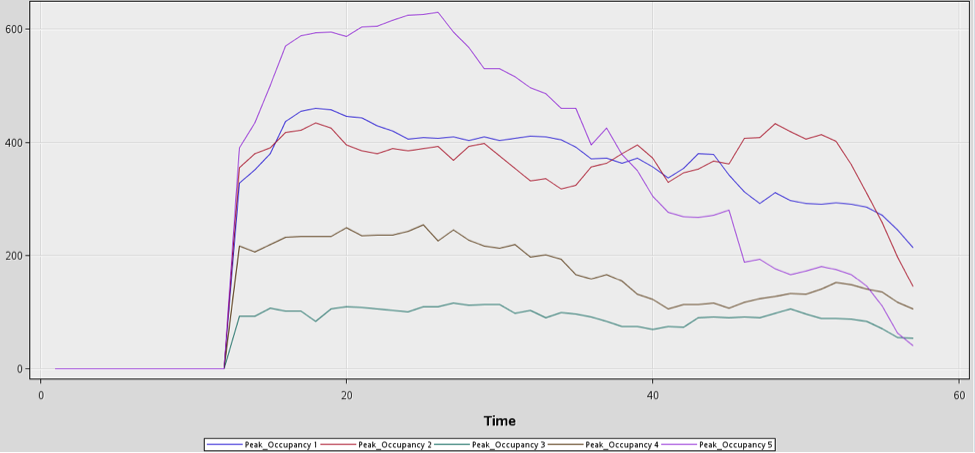
Starts increasing throughout the day from 10:00am onwards. Increasing trend increases by a larger amount starting at 11:30am. At 1:45pm, the non-peak occupancy starts to decrease quite sharply but never reaching back the 11:30am levels.
The non-peak occupancy levels continue falling albeit very slowly until 5:30pm where a spike in occupancy can be observed. The most pronounced of which coming from Vivocity development site while there is a smaller rate of increase for the other 4 developments.
The interesting thing about this pattern is that the dip after 1:45pm is not extremely pronounced, the largest dip is only around 25% of the maximum occupancy (1:15pm compared to 5:15pm). This pattern is unique to this cluster and is not reflected in other clusters where the dip in occupancy is much more pronounced after the meal timings.
This unique cluster behavior is reflected according to the main purpose of visit as per site survey data. Majority of patrons (more than 50%) arrive for Food & Beverage and Shopping. Food & Beverage behavior is reflected in the spikes during meal times and patrons arriving for shopping purposes cause the fall of occupancy to not be very pronounced after meal times as compared to other clusters.
In addition to patron behavior of the developments, these sites are also all located very close to or right beside bus interchanges. This common characteristic throughout developments might be a critical factor that causes the developments to be similar and clustered together.
Cluster 2
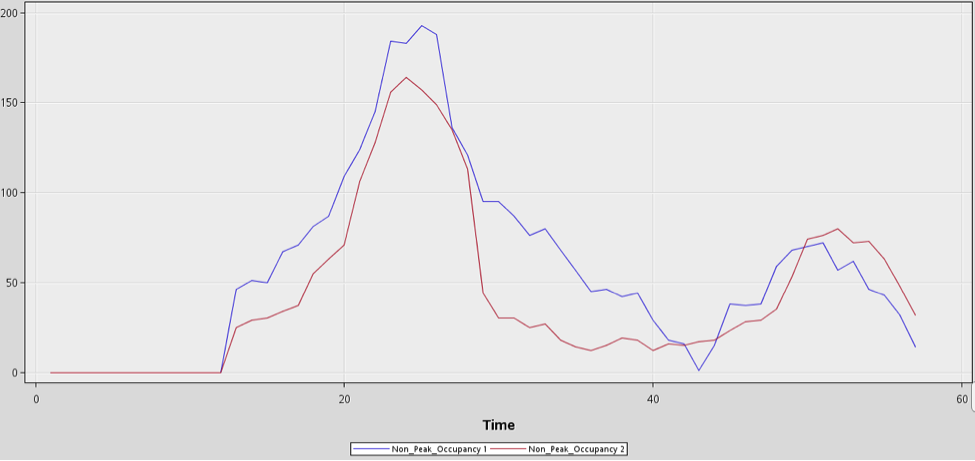
It is found that majority visit retail malls in this clusters for shopping and F&B. According to the time series graph, all retail malls in the cluster starts to gradually increase in the number of occupancy from 11:45pm to 1:00pm before dropping and maintaining at a low level of occupancy. It starts to gradually increase again from 6pm to 8pm. The highest level of occupancy for all the retail malls in this clusters fall during 6pm to 9pm.
The interesting thing about this pattern is that the dip after 1:00pm is quite significant for around 30% of the maximum occupancy and retains a constant decreasing trend in the level of occupancy. This pattern is unique to this cluster and is not reflected in other clusters where the dip in occupancy is lesser after the meal timings. This shows that visitors frequent the retail malls in this cluster during meal-time (i.e. lunch break and end work).
Cluster 3
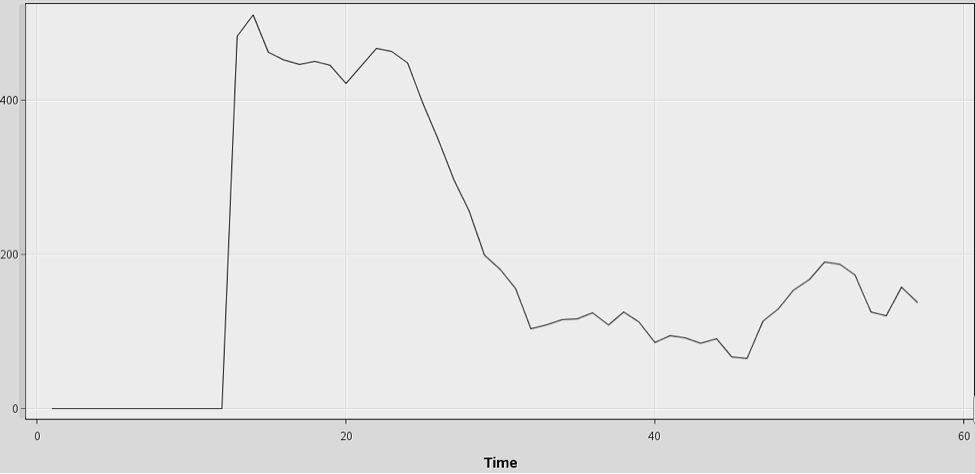
Cluster 3 consists of Boon Lay Shopping Centre. It is clustered by itself as the development site does not have a development carpark and the carpark used for analysis was an open carpark shared by multiple HDBs.
Cluster 4
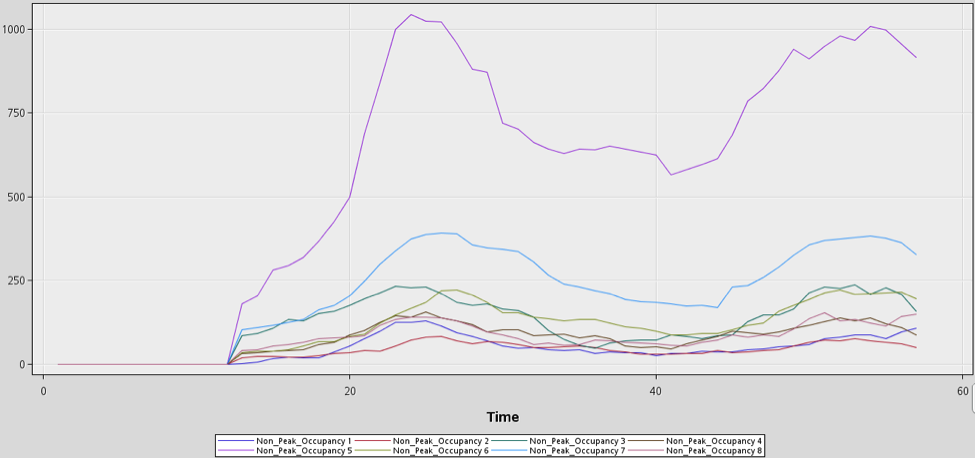
It is found that majority visits retail malls in this clusters for F&B and other activities (social activities, enrichment class, cinema, and supermarket). According to the time series graph, the peak hours of retail malls in this cluster fall during 12 noon to 12:45pm and 6:45pm to 8:00pm. However, the overall graph of majority retail malls in this cluster is very inconsistent. This might be due to the fact that some of the retail malls in this clusters being right next to each other.
For example, Tampines One and Century square, and Novena Square, Square2 and United Square. As the retail malls are connected and right next to each other, the number of car occupancy of connected retail malls might be dependent with each other.
Cluster 5
This cluster shows an increase in car occupancy throughout the day from 10:45am onwards. There is an increasing trend from 10:45am to 12:45pm. At 12:45pm, the non-peak occupancy starts to decrease very sharply all the way till 5:45pm before it starts increasing again from 5:45pm to 7:45pm.
The interesting thing about this pattern is that the dip after 12:45pm is very significant for around 70% of the maximum occupancy and it does not retains a constant decreasing trend in the level of occupancy. This pattern is unique to this cluster and is not reflected in any other clusters where the increase in level of occupancy only happens from 10:45am to 12:45pm (breakfast + lunch) and 5:45pm to 7:45pm (dinner).
This shows that there is a high percentage of visitors frequenting the retail malls in this clusters solely for meals. Both malls are located very near to a University (SUTD and NUS) and a Hospital (CGH and NUH). Moreover, shuttle buses are also provided to the retail malls in this cluster during meal time.
Cluster 6
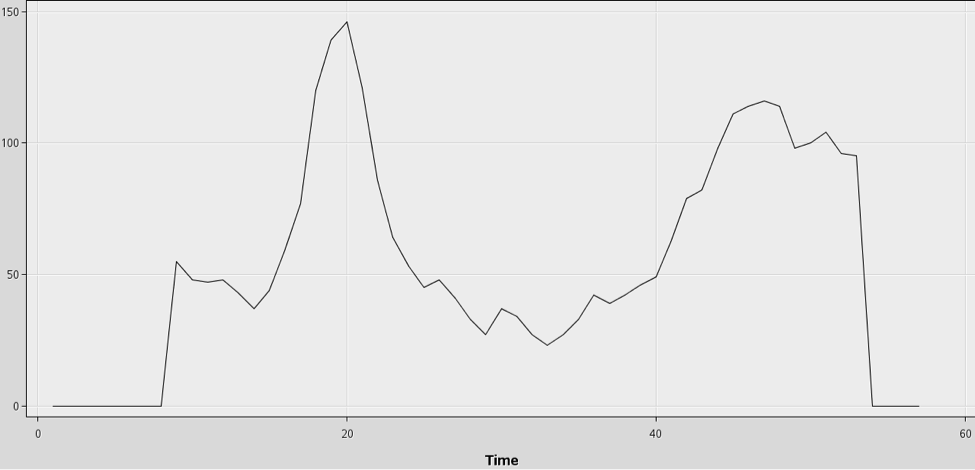
Cluster 6 consists of Pioneer Mall. It is clustered by itself as the development site does not have a development carpark and the carpark used for analysis was a multi storey carpark which is being shared with Blk 638A.
CONCLUSION
Limitations and Assumptions
Although the team managed to do a proper time series analysis with the raw data set provided by the consultancy firm, there are many limitations that might cause issues as well as potential avenues of improvement for further studies.
The team believed that there are many ways that would help to improve and strengthen the current project analysis and findings. For instance, increasing the scalability of the datasets without hindering on time and performance, this will provide us a better understanding and greater insights of the car park sites. Hence, this will improve on the team effort too.
One of the main limitations is the limited data, instead of only one day for peak and one day for off peak from 1000hrs to 2100hrs, ideally data should be collected over a few weeks or months. A larger dataset will allow us to identify more seasonal patterns such as monthly or quarterly patterns. Additionally, instead of just limiting to analyze 28 retail malls car park sites, we can also include other shopping malls.
Secondly, instead of just counting the raw numbers of cars in each lot, a better form of data collection can be to place video cameras to keep track of duration a unique car stays in the parking lot. This opens up more avenues for car park analysis and allows deeper insights.
Lastly, we feel that the data recorded are deficient, as the records do not show the type of cars (i.e. sedan, hatchback, MPV or SUV car) and the number of passenger onboard of each car. By having this information, it will help the analysis by understanding the car park and patron demographic information.
Possible Avenue for Future Works
As briefly mentioned earlier, our team analysis is made based on 28 retail malls car park sites. By increasing the number of car park sites and other developments (HDB estate and etc.) into the analysis will help the team to further improve on the analysis and drilling deeper to find out more.
Apart from having more records, the other initiative will be building an interactive dashboard to visualize the data. This can be achieved by using R programming language.
Summary
In conclusion, we hope that through the work performed, we are able to bring about much needed insights to the parking allocation policies of developments. Through time series data mining, we hope to have recommend the authority on ways to improve the system though identifying the trends of parking occupancies based on activity or location of developments. Currently, the authority utilizes a number of retail shop policy, namely the development car park has to have a minimum number of parking lots based on the number of retail shops in that development. The auhtority will manually analyse each proposal on a case by case basis and identify if any developments requires additional parking lots. For example if there is an interchange there and will require more lots from the developer.
The authority should consider looking into a Varied Pricing system that utilizes time series to predict the demand of parking lots and vary the car park pricing based on projections. Many locations overseas already utilize this system namely San Francisco in the United States where SFPark has been successfully been implemented with huge success.
However to carry out this study to accurately project the demand and price level of car parks, further more in depth analysis and data collection needs to be carried out, our group hopes that despite the limitations mentioned above, there is enough support and evidence to justify an investment into this analysis as parking issues not only cause congestion on the road due to overspill but also potential accidents and loss of lives.

