Atom InterimProgress
|
|
Contents
- 1 Revised Scope of work
- 2 Review of Previous Work
- 3 Data Cleaning and Explorations
- 4 Initial Approach
- 5 Revised Analysis Approach
- 6 Further Analysis
- 7 Revised Tools & Technology
- 8 Limitations and Assumptions
- 9 Revised Risk Assessment
- 10 Revised Milestones & Deliverables
- 11 Possible avenues for extension of project in the future
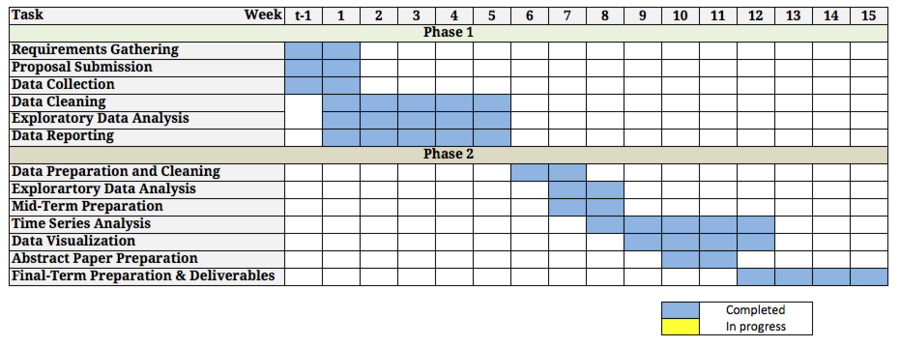
- 12 Timeline
Revised Scope of work
Phase 1 [Completed]
Phase 1 of the project will take place till end of January or when all the project reports and info-graphics are completed (whichever is earlier). We will be focusing on helping our project sponsor (MRC): -
• To ascertain parking demand and thereafter, to revise parking planning provision for sites
• To check for data errors and anomalies
• To generate charts and tables
• To generate infographics with the data given
• To identify significant trends (if any) and across relevant key categories
• To compare data percentages and correlations between car park demand and human traffic count
• To compare data percentages and correlations between the use of public transport and human traffic count
• To compile all generated data, charts and infographics into a written report
Phase 2
Phase 2 of the project will take place from February till the end of the course. We will be building a platform for data representation: -
• To compare the differnece occupancy rate between the sites
• To check for data errors and anomalies
• To generate charts and tables
• To generate infographics with the data given
• To identify significant trends (if any) and across relevant key categories
• To compile all generated data, charts and infographics into a written report
Review of Previous Work
Phase 1 [Completed]
Thus far, we have managed to complete phase 1 of the project in January, which is to assist MRC to understand the car park issues in 6 development sites (AMK hub, AMK hawker centre, Compass Point, Jalan Salang F&B cluster, Rail Mall F&B cluster and Sengkang CC). MRC has categorized AMK hub and AMK hawker centre to be grouped together initially as given between the two sites is pretty nearby to each other. Likewise for Compass Point and Sengkang CC to be grouped together to form Sengkang Cluster. As for the deliverables for phase 1, the team has analyzed and completed these deliverables for MRC:
Excel files:
1. AMK Hub.xlsx (7 tabs)
2. AMK Hawker Centre.xlsx (7 tabs)
3. Compass Point.xlsx (7 tabs)
4. Sengkang CC.xlsx (7 tabs)
5. Rail Mall.xlsx (7 tabs)
6. Jalan Salang.xlsx (7 tabs)
Report files:
1. AMK Cluster.pdf (82 pages)
2. SengKang.pdf (99 pages)
3. Rail Mall.pdf (87 pages)
4. Jalan Salang.pdf (62 pages)
Info-graphics files:
1. AMK Hub.pdf (7 slides)
2. AMK Hawker Centre.pdf (8 slides)
3. Compass Point.pdf (8 slides)
4. Sengkang CC.pdf (9 slides)
5. Rail Mall.pdf (11 slides)
6. Jalan Salang.pdf (11 slides)
The excel files are processed to assist in analyzing and plotting out the charts for the info-graphics. The reports are generated to share and report the insights found in the development. Lastly, the info-graphics documents are prepared to capture and share the main insights from the respective sites.
Due to the file size is too huge and it is unable to upload onto SMU elearn, please refer to https://wiki.smu.edu.sg/ANLY482/Atom%3A_Documentation#Phase_1 to view or download the file.
Phase 2
We will be utilizing the raw data provided by MRC to do more in depth analysis than what was required in Phase 1 of the project. Phase 1 did more of a summary of each parking site individually. In phase 2 we proposed time series data mining in order to identify and analyze any patterns that might exist between different parking sites, for example perhaps there might be a similarity between a retail mall in the east and west that might not be obvious from a superficial view of the data. Time series dating mining allows us to represent a collection of data that is obtained over a period of time, which allows us to view the shape of the data over time.
Data Cleaning and Explorations
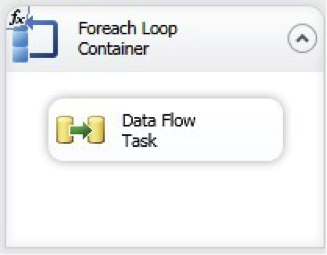
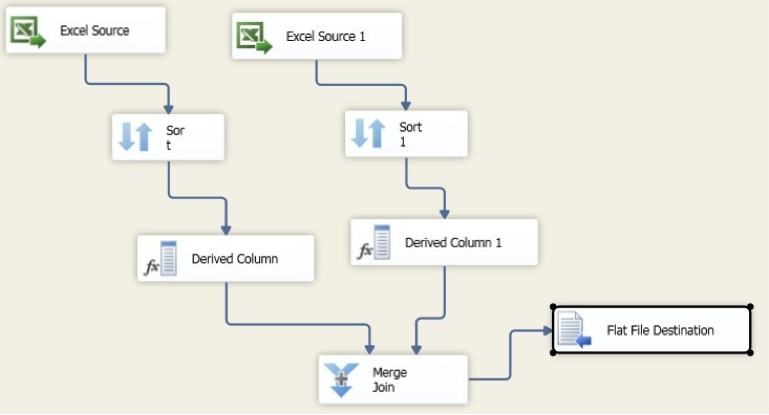
The data we received from MRC was site based and split up into individual excel files with a lot of unnecessary data. After Exploratory Data analysis there is a need to transform the time-based data into appropriately time stamped time series data in order to perform further analysis. For our group we utilized SQL Server Integration Services 2010 to look through all excel files and extract relevant data, as we were comfortable using this software from previous projects.
Filtering and extracting data
There were many variables in the excel sheet that was not helpful for our phase 2 analysis. We have decided on using 6 variables for our analysis, which are the most relevant to what we would like to analyze. The variables are peak_occupancy, non_peak_occupancy, peak_car_in, non_peak_car_in, peak_car_out, non_peak_car_out. We also filtered out 112 Katong as it was a pilot site and there were many missing data.
Combining Data
As the data we received from MRC was site based and split up into individual excel files, there is a need for us to combine all the sites together after filtering and extracting data from individual excel files. This file, includes attributes such as time, car_park, total_lots, peak_occupancy, non_peak_occupancy, peak_car_in, non_peak_car_in, peak_car_out, non_peak_car_out. There are a total of 28 sites that we plan to carry out our analysis.
Recoding Time
As the time given was in ##:##AM/PM format, there was a need for us to recode it into numbers in order for us to run Time Series Analysis on SAS Enterprise Miner. We used SAS Enterprise Guide to recode our time to Time ID starting from 1 before loading the cleaned data into SAS Server.
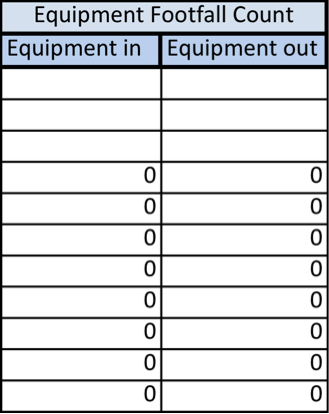
Figure above shows that there are unnecessary rows and columns of data as they are empty. Figure 4 below shows that the recoded data after cleaning has been done.
Initial Approach
Initially our approach was to manually group the parking establishments by region before doing time series analysis. However after we consulted with Professor Kam on Feb 18, the errors of our method was highlighted to us:
The dataset should be telling us what are the groups and patterns instead of us manually deciding how to segregate the data.
Revised Analysis Approach
Time Series Methodology
We utilized SAS Enterprise Miner, which simplifies time series data mining for huge amounts of data. Additionally Enterprise Miner implements Dynamic Time Warping which is an algorithm for measuring similarity between two times based sequences which might initially vary, Enterprise Miner can identify patterns and similarities by shifting time series against each other.
Dataset
First we uploaded our transformed data set into the SAS Server and in Enterprise Miner we retrieved this data set and defined the properties for Enterprise Miner to correctly identify the roles of each variable.
Time Series Data Preparation (TSDP)
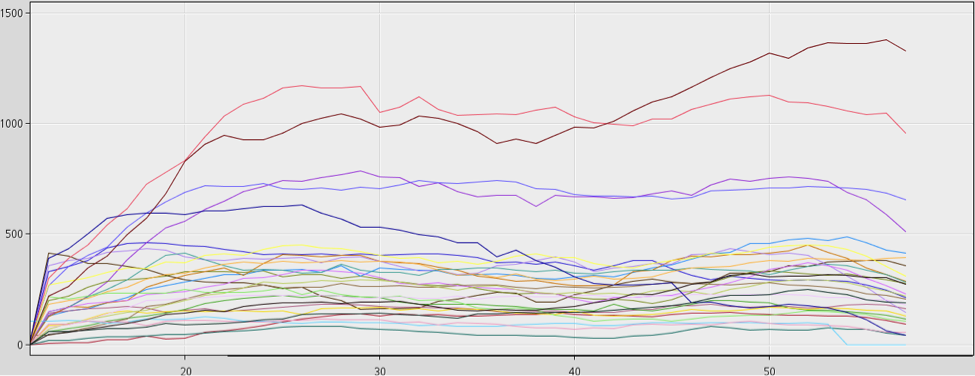
TSDP transforms the dataset that is readable by Enterprise Miner, i.e. time stamped data.
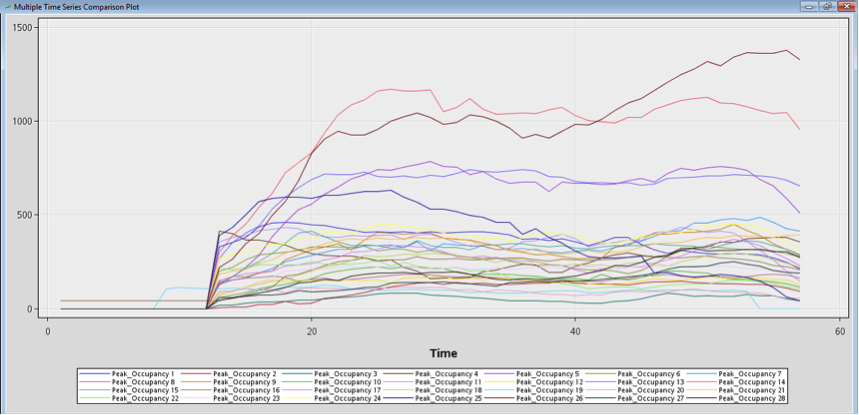
Multiple Time Series Plot
TSID Map Table
TSID map table shows the original Dataset mapped into different time series and their corresponding Car_Park names.
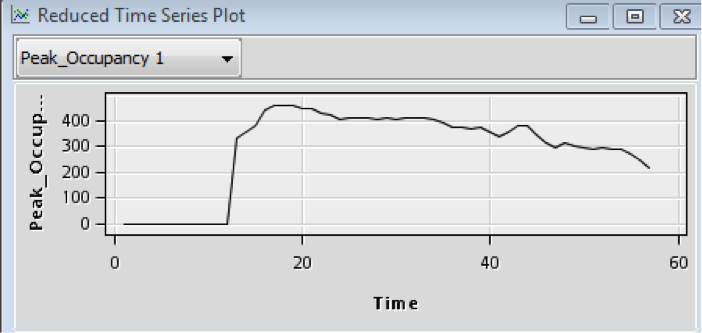
Reduced Time Series Plot
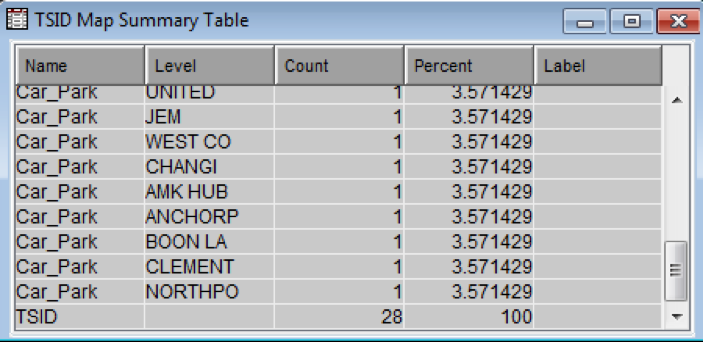
TSID Map Summary Table
TSID Map Summary Table shows the different Car_Parks and their unique Time Series counts, in total we have 28 Retail Mall car parks to analyze.
Time Series Similarity (TSS)
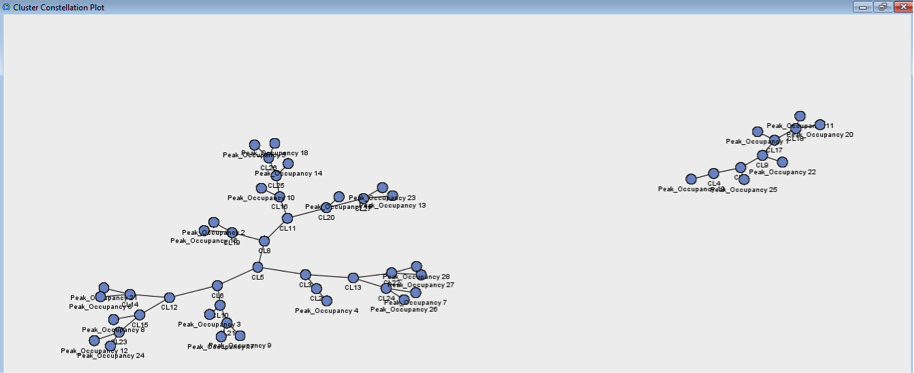
Allows us to analyze similarities between different time series grouped by clusters. Dynamic Time Warping algorithm is applied in Enterprise Miner to match the different lengths of similar time series in one group.
Cluster Constellation Plot
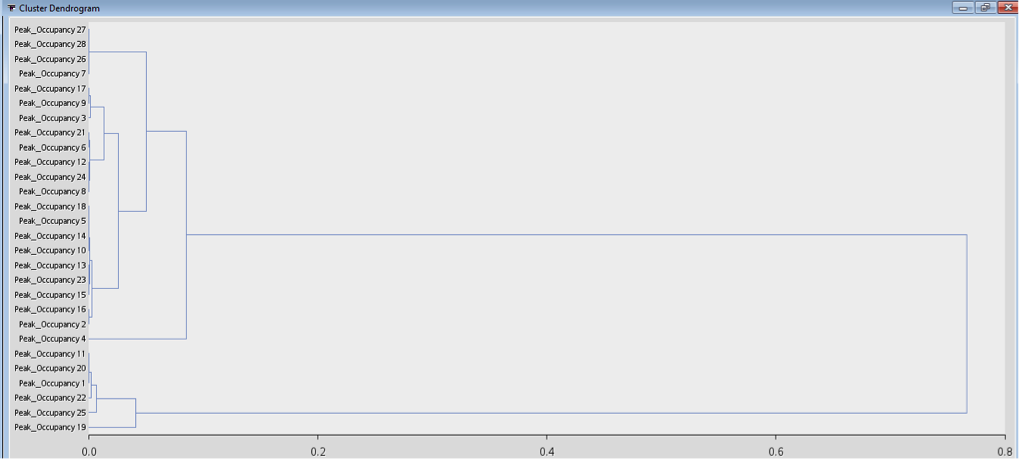
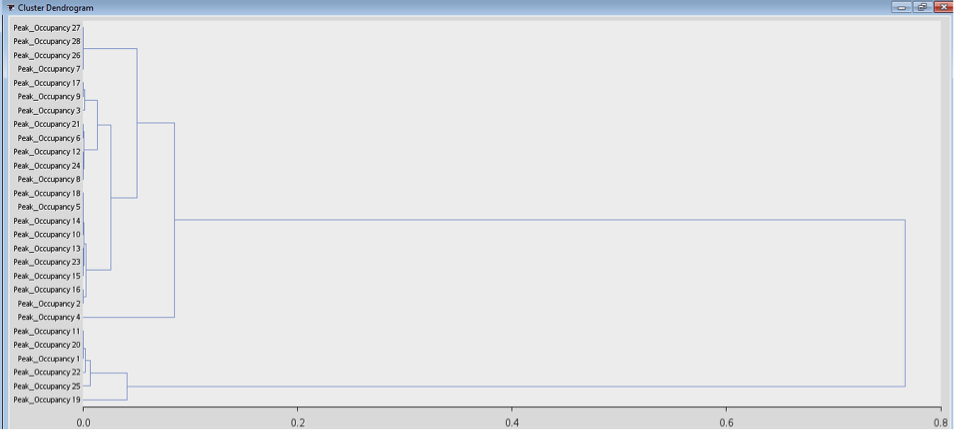
Cluster Dendrogram
A tree hierarchy displays the steps and how the clusters are actually formed.
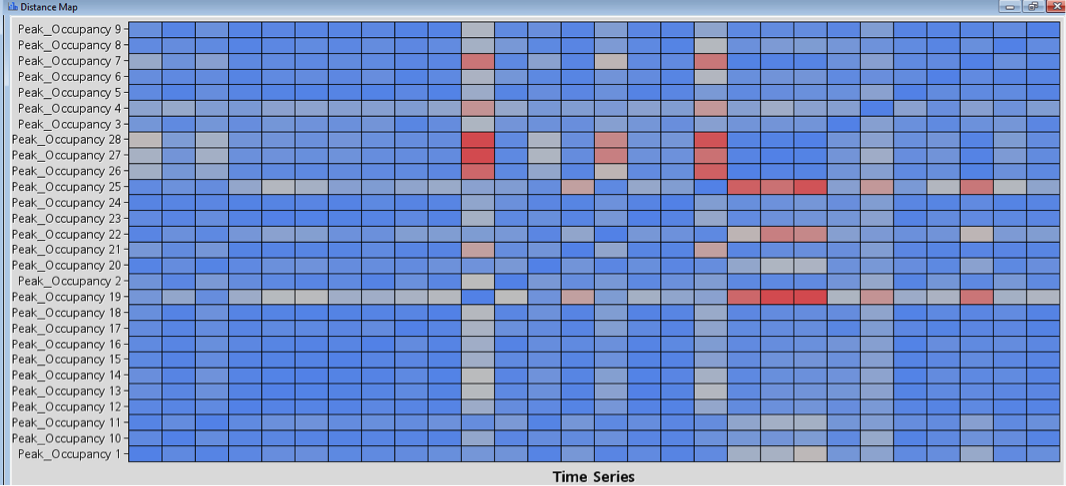
Distance Map
Distance map shows how similar the Time Series data is based on distance between clusters. Red indicates a large distance and dissimilarity and Blue indicates little distance and similarity.
Further Analysis
The resulting time series graphs show that there might be some similarities between the car parks, however we would not be able to identify them without any further analysis of the Time series.
According to the Dendrogram generated, it appears that at Point 1, Enterprise Miner makes a big jump in order to combine 2 clusters. This is not ideal when trying to interpret and analyze patterns and similarities within the clusters.
At this stage our group had to identify what is a reasonable combination of clusters and what is considered unreasonable based on the Dendrogram. After research and advice from our supervisor, we decided that at Point 2 the clusters are still distinct enough and will be easier to identify any similarities. At point 2 there should be 7 distinct clusters within this set of time series data.
Findings
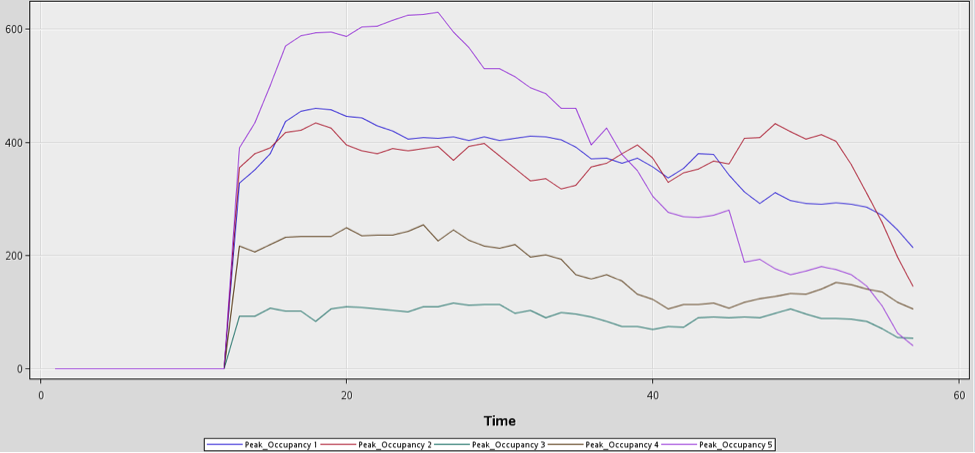
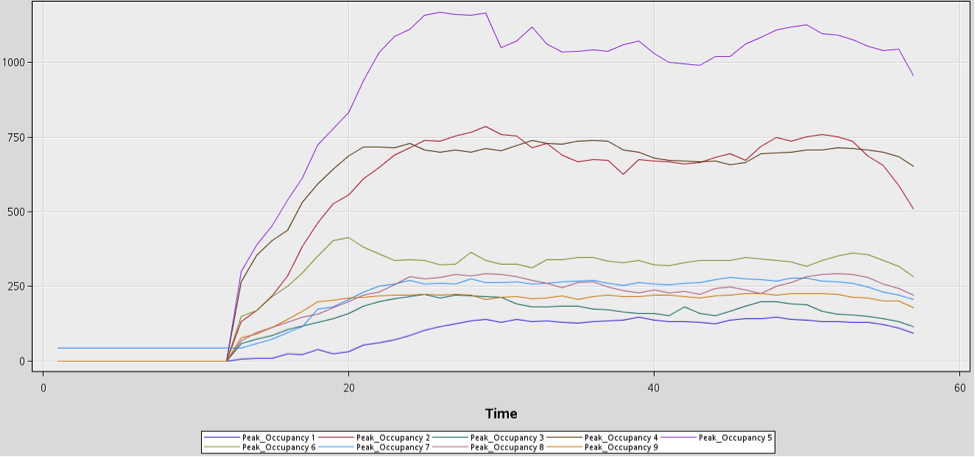
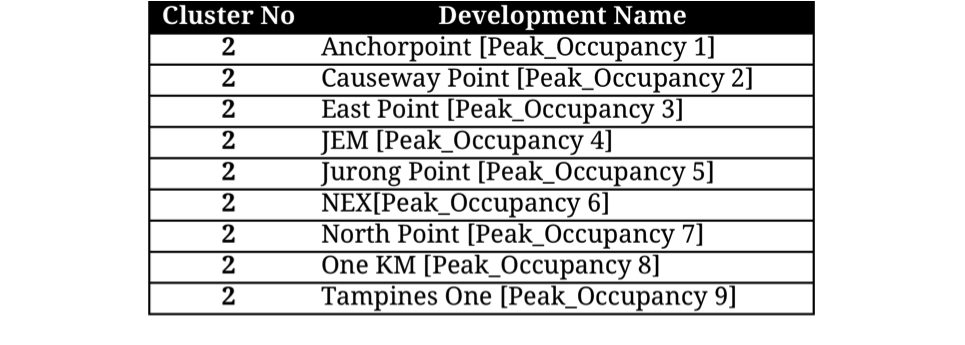
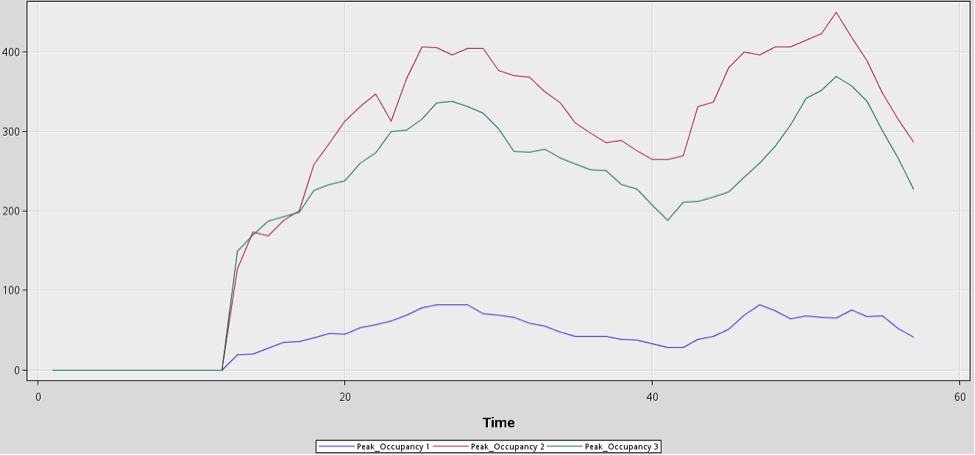
By repeating the steps taken above to load the data into the SAS server, we generated 7 smaller subsets of time series data sets from the main data set. From here our group identified the car parks that belonged to the different clusters, namely:
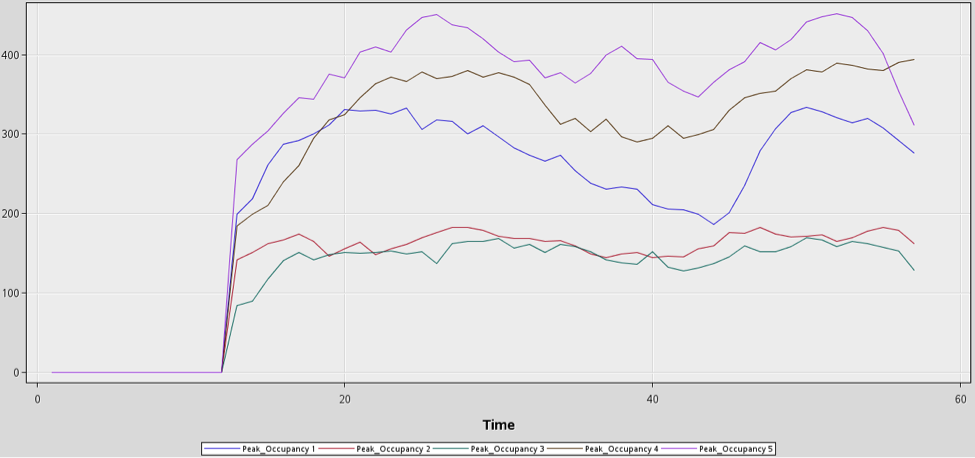
An interesting cluster is cluster 1, the retail malls that belong in this cluster are located within or around Ang Mo Kio, Hougang and Novena, which are very close to each other geographically.
Cluster 1 shows large occupancy in the car parks at 1000 hrs when the data collection starts. There is only one large peak in the morning and the number of cars during peak hour stays almost the same throughout the day, only dropping near 1800 hrs. This pattern suggests that there might be a lot of parking lots occupied by workers of these shopping malls, or there is just a high demand for car parks and any cars that incoming cars replace leaves quickly. This can be further investigated utilizing different target variables.
Similar to cluster 1, there is a steady rate of car occupancy in cluster 2 during peak hours and suggests similar trends as cluster 1. However the difference is that nearing 2100 hrs there is no drastic drop shown in cluster 1, this suggests that there are a lot of activities available at these retail malls after 2100 hrs that attract patrons to continue parking even near closing hours.
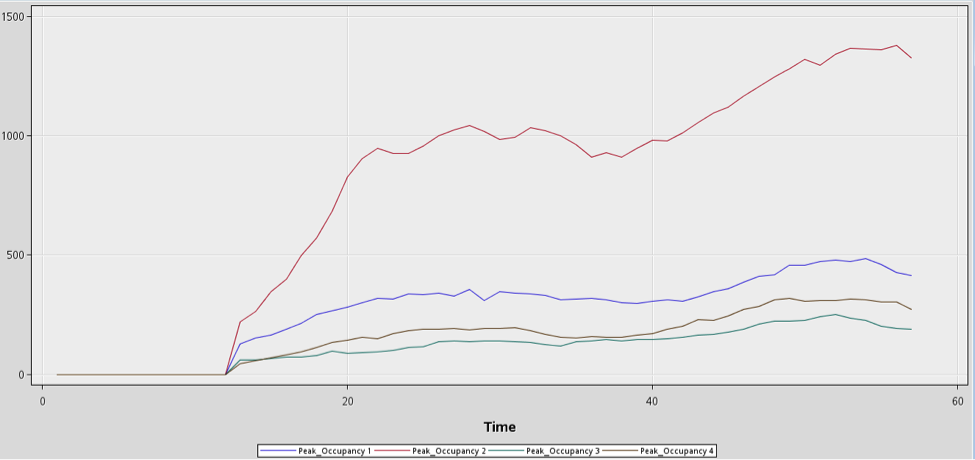
Cluster 3 shows 2 obvious spikes and 2 dips throughout the day. The first spike occurs at around 1200 hrs and then starts to dip at 1345 hrs. The second spike begins at around 1800 hrs and begins to dip at 2015hrs This patterns in spikes and dips in occupancy suggests many patrons visiting these retail malls for dining purposes, parking at the retail mall only for the duration of their meals.
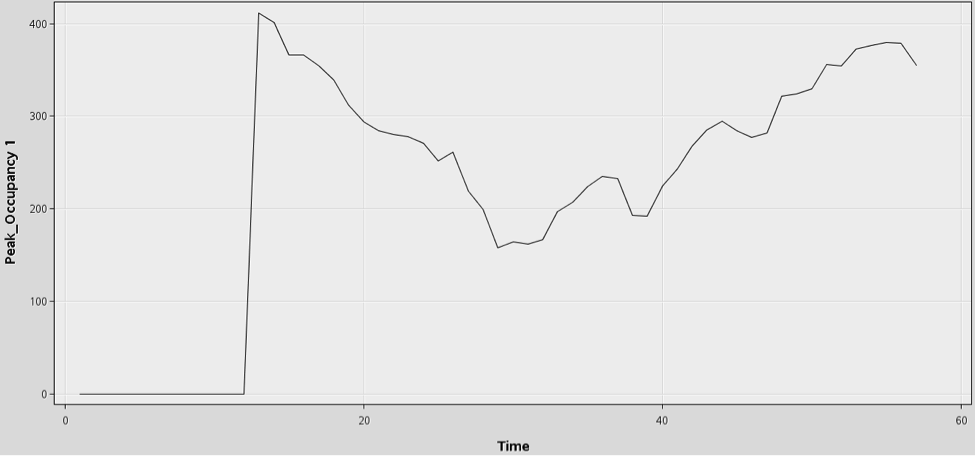
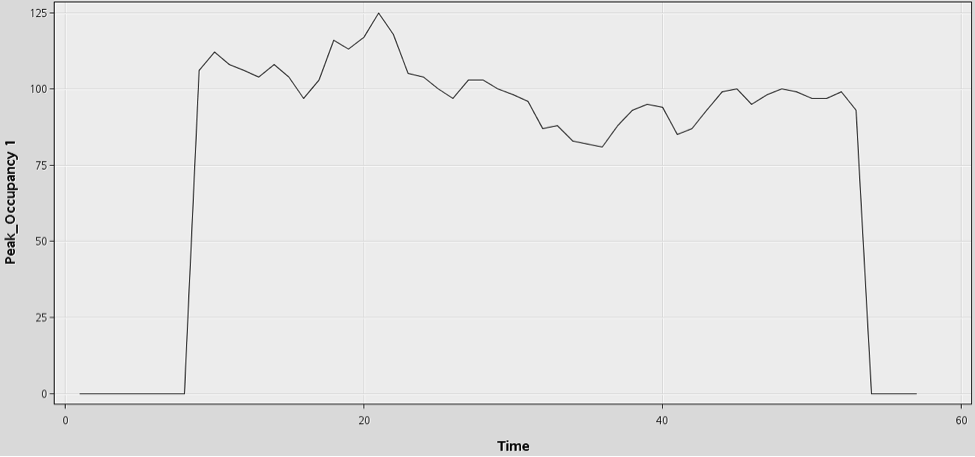
From the results we identified a few interesting similarities and insights. Boon Lay Shopping Centre and Pioneer Mall appear to be outliers, two retail malls located in the West of Singapore that are significantly different from the rest of the retail malls recorded in the data set but not similar enough to belong in the same cluster.
Moving forward after the Interim Report, our group will discuss how to analyze cluster 4 and 7 under advisement from our Supervising Professor.
Additionally we would like to look into different target variables in order to determine if the retail malls exhibit more similarities other than occupancy rate during peak hours.
Lastly, we would like to look into more establishments other than retail malls such as F&B Clusters and Community Centers.
Revised Tools & Technology
Reporting Tools:
1. Microsoft Word
2. Microsoft PowerPoint
Analysis & Visualization Tools:
1. Microsoft Excel
2. SAS Enterprise Miner
3. JMP Pro
4. Microsoft SSIS (SQL Server Integration Services)
Collaboration tools:
1. Dropbox
2. Google Drive
3. SMU Wikipedia
Limitations and Assumptions
Revised Risk Assessment
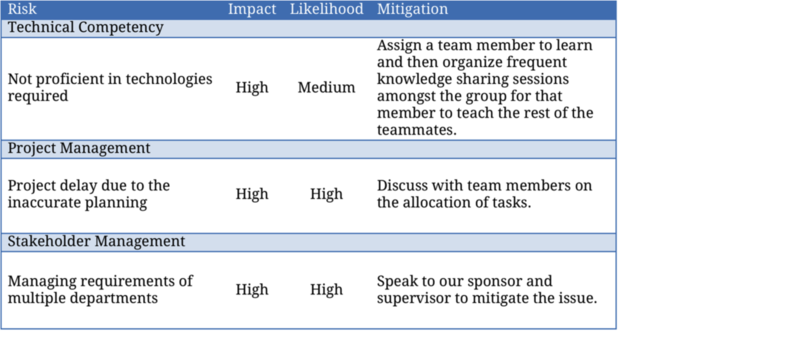
The team has identified technical competency, project management and stakeholder management as the highest impact risks, as shown below:
Revised Milestones & Deliverables
1. Team Wiki page [1]
2. Project Proposal (Week 1 – 10th Jan 2016)
3. Interim Progress Report (Week 8 – 28th Feb 2016)
4. Abstract Submission (Week 10 – 13th Mar 2016)
5. Full Paper Submission (Week 12 – 27th Mar 2016)
6. Final Paper Submission (Week 15 – 17th Apr 2016)
7. Final Term Presentation (Week 15 – 11th – 17th Apr 2016)
8. Poster (Week 16 – 21st Apr 2016)
Possible avenues for extension of project in the future
The team believed that the following ways would help improve the current project analysis and findings:
• Increase the scalability of the datasets without hindering on time and performance
• Increase the number of car park sites and other developments (HDB estate and etc.) into the analysis
• Increase the number of the days for observations

