ANLY482 Team wiki: 2015T2 TeamROLL Data Analysis
| Data Cleaning | Page EDA | Post EDA |
Data Cleaning Log
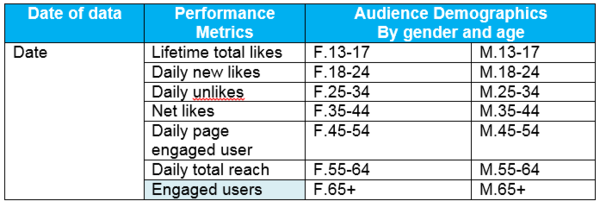
Page Data
Firstly, attributes were selected for analysis, which were
Other attributes were removed from analysis after discussion with our project sponsor. The main reasons for doing so would be: 1) our focus on net rather than organic metrics, 2) redundancy of paid posts as no posts were paid for, 3) redundancy of check-in metrics since this was not a hotel or destination services business, and 4) the omission of video formats for current analysis which is limited to pictorial posts.
Secondly, we checked the file for missing data entries. Since data was recorded on a daily basis, we found that all days were accounted for our period of review, 1 Jan 2015 - 31 Dec 2015. Thus, there was no need to treat any missing data points.
Lastly, with the above two processes in place, we now have our completed Page-Level analytical data cube ready to be used for data analysis.
Post Data
Data preparation for Post Level data was more complicated due to its granularity and larger number of observations recorded.
Firstly, post level data extraction resulted in a combination of data sheets each recording different aspects of post performance. Some examples are: Key performance metrics.tab, Lifetime talking about this.tab, Lifetime Negative Feedback.tab, etc. These different metrics are identified for individual posts via unique Post IDs. Thus, the function =index(match) on Excel was used to recombine all these metrics into a single data sheet, matched by Post IDs.
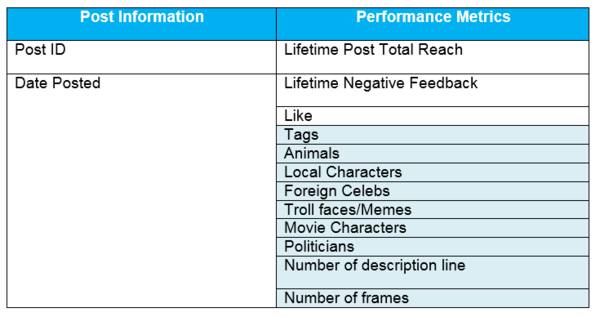
Secondly, attributes were selected for analysis, which were
Similar to page level attributes selection, other attributes were removed from analysis after discussion with our project sponsor. The main reasons for doing so would also be: 1) focus on net rather than organic metrics, 2) redundancy of paid posts as no posts were paid for, 3) the omission of video formats for current analysis which is limited to pictorial posts, and 4) only direct engagement response metrics "like", "share", "comment" and direct negative feedback metrics "hide_all_clicks", "hide_clicks", "report_spam_clicks" and "unlike_page_clicks", were included in addition to general performance metrics since the other optional additional attributes were already well represented by the general performance metrics.
Thirdly, of the three types of post formats recorded ("Types"), we selected only "photo" and removed "links" and "video" formats. "Photo" indicated the bulk of SGAG's content, which are memes. "Link" and "Video" indicated secondary content types of listicles and youtube videos, which will not be the focus of our study.
Fourthly, each selected post was tagged according to their topics and design attributes. As discussed above, we used a textual tagging system to indicate post topics and themes. For design attributes, once again in consultation with SGAG, we identified three main areas of design, namely 1) character use, 2) number of frames, and 3) number of description lines within the picture. Character use had 6 main character types, and dummy coding was used. Number of frames was indicated with either "1", "2" "3" or ">3", since most of the posts were designed to attempt to fall within three or less frames. Similarly, number of description lines is also indicated with either "1", "2", "3" or ">3".
Fifthly, the team noticed that the attributed "Posted" which recorded the date and time of post release contained a large number of posts which were released between 000h-0600h daily. This is strange as these are the sleeping hours of Singaporeans and would thus make no sense for anyone to be releasing the posts so late at night. Through online research, we found that Facebook Insights recorded "Posted" according to Pacific Time rather than local time. As such, there was a need to recode "Posted" forward by 16 hours to match with local SG time. This was done by adding 16 hours ( =+0.667) to the previous recorded time. With a check on the newly calculated local time, majority of posts were released within the expected timings of 0900-2100h in local time.
Sixthly, the team examined the data for missing values and found some observations with missing values for performance attributes. The cause for these missing values is not known, though we suspect the cause to be another limitation in Facebook Insights attribute retrieval for specific types of posts, such as linked posts. However, the number of such missing values is very small, comprising around 2% of our dataset. As such, we have decided to omit these missing values during our analysis.
Lastly, with the above processes in place, we now have our completed Post-Level analytical data cube ready to be used for data analysis.


