ANLY482 Team wiki: 2015T2 TeamROLL Data Anlysis/Page
| Data Cleaning | Page-Level Analysis | Post-Level Analysis |
Contents
- 1 Exploratory Data Analysis: Lifetime Total Likes
- 2 Exploratory Data Analysis: Female Age Group Demographics
- 3 Exploratory Data Analysis: Male Age Group Demographics
- 4 Time Series Analysis: Net change (%) in daily lifetime total likes
- 5 Time Series Analysis: Daily news likes and unlikes
- 6 Time Series Analysis: Average daily total reach
- 7 Time Series Analysis: Average number of engaged users
- 8 Time Series Analysis: Percentage of engaged users over total reach
Exploratory Data Analysis: Lifetime Total Likes
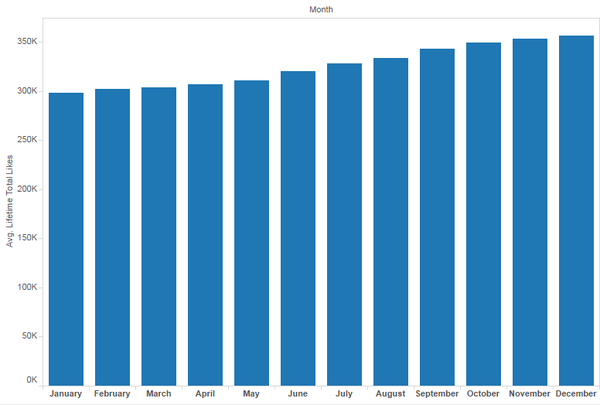
From the months January to December 2015, there is an increasing trend in number of lifetime total page likes. The sharpest increase are in June with 9658 likes, and September with 8923 likes. We hypothesize that this can attributed to content created for two very popular events during the same time period: the Southeast Asian Games (June), and Singapore's General Election (September).
Exploratory Data Analysis: Female Age Group Demographics
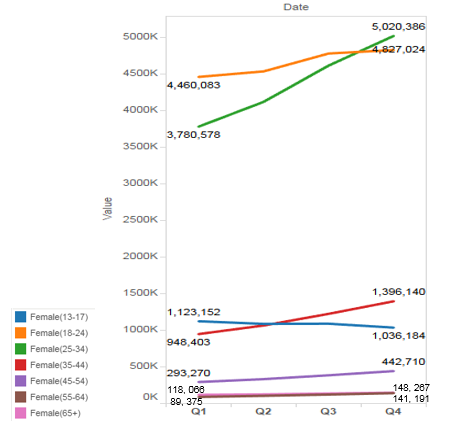
We see that SGAG has indeed successfully reached out to their target group, which audience members of ages 18-34, forming the bulk of their female audience. In terms of growth rate, the segment with ages 25-34 has shown the greatest growth forming the majority of age group by the last quarter of 2015. This is probably because SGAG's content resonated most with this group of audience members.
However we have to note that the audience member between 13 to 17 years old have shown a decrease in viewership.
Exploratory Data Analysis: Male Age Group Demographics
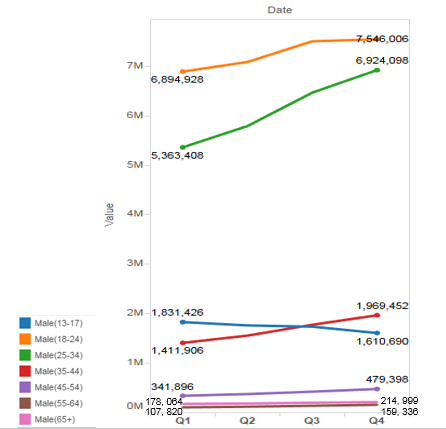
Similarly, we see an increasing trend in the number of page like among SGAG's male audience. Also, SGAG has also had most success in reaching to their target group of 18-34 year old males, with the age range of 25-34 years old showing greatest growth for the year 2015.
Time Series Analysis: Net change (%) in daily lifetime total likes
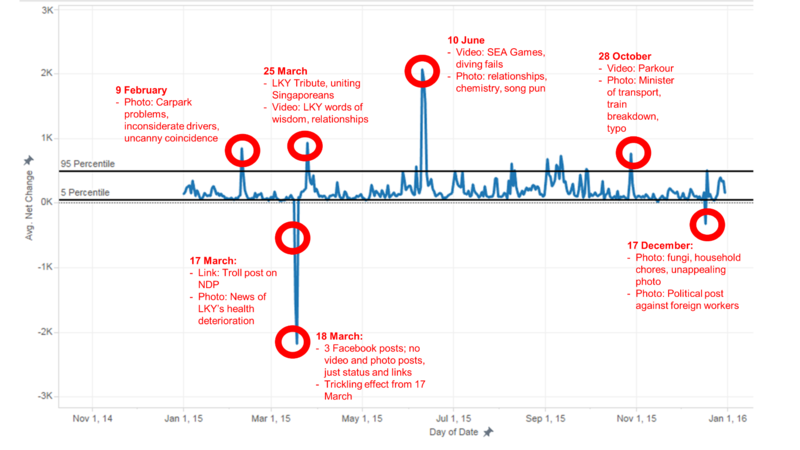
We conducted time series analysis to identify the days with an influx in the number likes and unlikes throughout the year (2015). From the graph obtained, we have identified 4 days that have performed substantially well in comparison to 95% of the data gathered.
We have identified posts with higher than average reach published on the 4 days identified:
1) Published on 9th February: A photo post with the following topics: transport, carpark problems, inconsiderate drivers, uncanny coincidence and bad parking.
2) Published on 25th March: 2 videos posts on Mr. Lee Kuan Yew(LKY) with the following topics: words of wisdom, relationships, marriage, LKY tribute and uniting Singaporeans.
3) Published on 10th June (*highest peak): A video post on Southeast-Asia Games with the following topics: diving fails, friendship, humor. A photo post with the following topics: relationships, chemistry and puns.
4) Published on 28th October: A video post on Parkour with the following topics: sports and cool stunts. A photo post with the following topics: Minister of Transport, train breakdown and funny typo.
From the posts identified, we can see that the audience are more inclined towards topics relating to transport and major events such as SEA Games and mr LKY’s death.
On the other hand, the posts with higher than average reach published on the weaker performing days are:
1) Published on 17th March: A link post with the following topics: troll, NDP, holiday, false alarm. A photo post with news on LKY’s deteriorating health.
2) Published on 18th March: Lack of post updates. 3 posts made; either textual facebook status update or links.
3) Published on 17th December: A photo post with the following topics: food, mushroom, mop, gross, unhygienic, household chores. Another photo post with the following topics: politics, against foreign manual workers.
From the posts published on weaker performing days, we can see that audience are less receptive towards negative news such as the deteriorating health of Mr. LKY, a fraud post related to national day, and a post against foreign manual workers.
Time Series Analysis: Daily news likes and unlikes
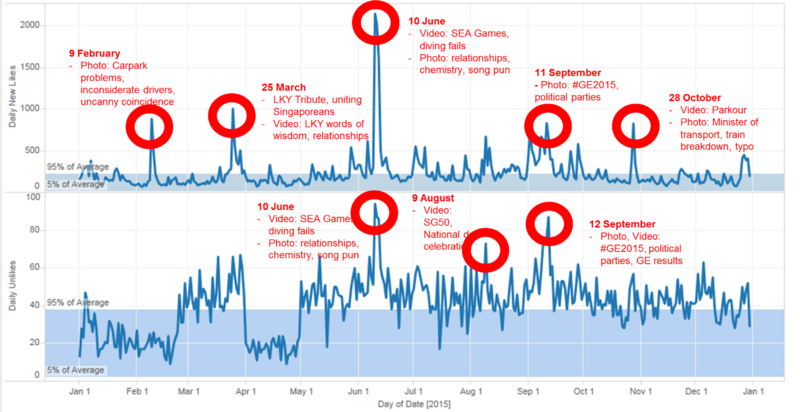
From the graphs identified, we have identified 5 peaks for the number of daily new likes and 3 peaks for the number of daily unlikes.
Taking the better performing posts into account, the following are the days that have performed significantly better in the number of likes, as compared to 95% of the average results garnered:
1) Published on 9th February: A photo post with the following topics: transport, carpark problems, inconsiderate drivers, uncanny coincidence and bad parking.
2) Published on 25th March: 2 videos posts on Mr. Lee Kuan Yew(LKY) with the following topics: words of wisdom, relationships, marriage, LKY tribute and uniting Singaporeans.
3) Published on 10th June (*highest peak): A video post on Southeast-Asia Games with the following topics: diving fails, friendship, humor. A photo post with the following topics: relationships, chemistry and puns.
4) Published on 11th September: A photo post with the following topics: politics, general elections, political parties.
5) Published on 28th October: A video post on Parkour with the following topics: sports and cool stunts. A photo post with the following topics: Minister of Transport, train breakdown and funny typo.
Similarly the following days have shown higher number of unlikes than 95% of the average data gathered:
1) Published on 10th June (*highest peak): A video post on Southeast-Asia Games with the following topics: diving fails, friendship, humor. A photo post with the following topics: relationships, chemistry and puns.
2) Published on 9th August: A video post with the following topics: national day, SG50, celebration
3) Published on 12th September: A photo and video post, both with the following topics: politics, general elections, political parties.
Both daily new likes and unlikes appear to move in the same direction, sharing similar peaks and troughs, with an overall slightly increasing trend. We can attribute number increased number of unlikes on 12th September to the trickling effect from the content that went viral on 11th September. We can then conclude that higher reach can result in higher engagement (including negative feedback such as unliking the page).
Time Series Analysis: Average daily total reach
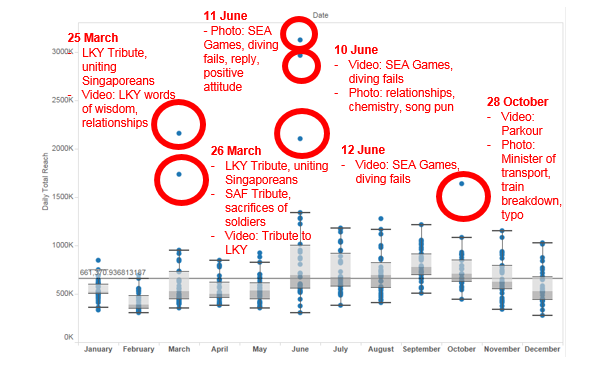
Taking into account the graph generated from the average daily total reach, we have identified the following outliers:
1) Published on 25th March: 2 video posts on Mr. Lee Kuan Yew(LKY) with the following topics: words of wisdom, relationships, marriage, LKY tribute and uniting Singaporeans.
2) Published on 26th March: Photo and video posts with the following topics: Mr. Lee Kuan Yew(LKY) words of wisdom, relationships, marriage, LKY tribute, SAF tribute, sacrifices of soldiers and uniting Singaporeans.
3) Published on 10th June: A video post on Southeast-Asia Games with the following topics: diving fails, friendship, humor. A photo post with the following topics: relationships, chemistry and puns.
4) Published on 11th June: A video post on Southeast-Asia Games with the following topics: diving fails, reply, positive attitude
5) Published on 12th June: A video post on Southeast-Asia Games with the following topics: diving fails, humor
6) Published on 28th October: A video post on Parkour with the following topics: sports and cool stunts. A photo post with the following topics: Minister of Transport, train breakdown and funny typo.
From the posts identified, we can see that SGAG strategically leveraged on the viral posts by posting similar content the following day, which have also performed significantly well.
Time Series Analysis: Average number of engaged users
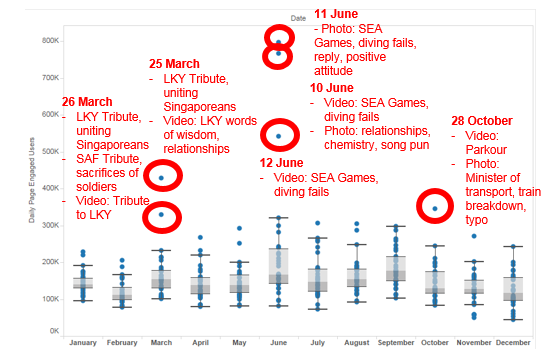
From the boxplot chart generated, we have identified the following outliers:
1) Published on 25th March: 2 video posts on Mr. Lee Kuan Yew(LKY) with the following topics: words of wisdom, relationships, marriage, LKY tribute and uniting Singaporeans.
2) Published on 26th March: Photo and video posts with the following topics: Mr. Lee Kuan Yew(LKY) words of wisdom, relationships, marriage, LKY tribute, SAF tribute, sacrifices of soldiers and uniting Singaporeans.
3) Published on 10th June: A video post on Southeast-Asia Games with the following topics: diving fails, friendship, humor. A photo post with the following topics: relationships, chemistry and puns.
4) Published on 11th June: A video post on Southeast-Asia Games with the following topics: diving fails, reply, positive attitude
5) Published on 12th June: A video post on Southeast-Asia Games with the following topics: diving fails, humor
6) Published on 28th October: A video post on Parkour with the following topics: sports and cool stunts. A photo post with the following topics: Minister of Transport, train breakdown and funny typo.
We have noted that the daily page engaged users and the average daily total reach share the same outliers. We can then conclude that posts that generated higher reach are more inclined to gather a higher engagement level.
Time Series Analysis: Percentage of engaged users over total reach
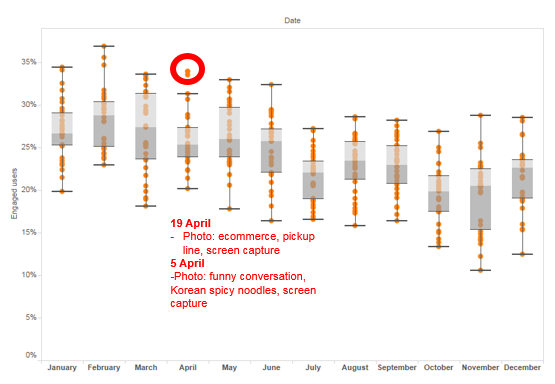
We have identified two outliers in the month of April.
1) Published on 5th April: A photo post with the following topics: funny conversation, Korean spicy noodles, screen capture
2) Published on 19th April: A photo post with the following topics: ecommerce, pickup line, screen capture
The two posts specified above generated higher engagement as compare the number of reach generated.
We can see that the rate of engaged users generally shows a decreasing trend. Rate of engaged users is the proportion of users who engaged with the SGAG Facebook Page (=daily page engaged users / daily total reach). It is thus interesting to note that although SGAG has earned an increasing number of page likes, this has not necessarily translated into greater audience response and engagement. Thus, SGAG's content generation still needs to enable audience to become more engaged.

