Visualization of Consumer Satisfaction Project Overview
| Home | Project Overview | Documentation |
Contents
Background
Consumer research has been a hot topic. Businesses and government agencies are interested to know the satisfaction levels of Singaporean consumers and effectively take actions that can create valuable and meaningful impact in the society. This project explores these satisfaction levels. It uses the respondent level data from the Customer Satisfaction Index of Singapore (2008-2013) for the following sub-sectors:
The metrics that measure satisfaction includes:

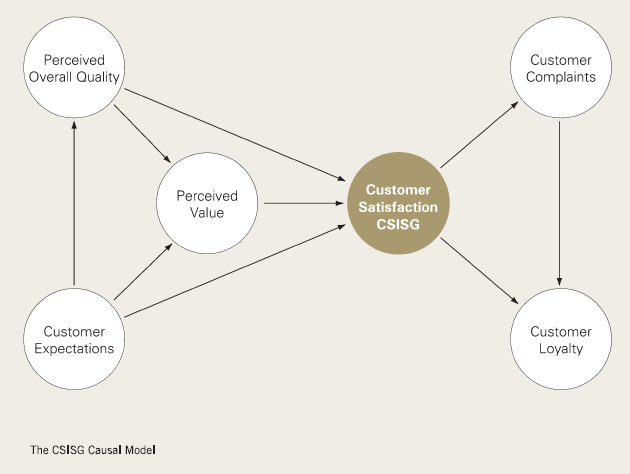
Note: Referenced from the CSISG Brochure
Motivation
The motivation for doing this project was based on our interest in presenting the data in an interesting way that will help users and business leaders derive fresh insights from the data. Through the visualizations, we hope to illustrate customer satisfaction in various measures as shown in the CSISG Causal Model above to provide the users with a better understanding of the data.
Objective
The objective of this project is to produce an interactive dashboard that shows market trends and customer satisfaction visually. We will try to incorporate a ‘fun’ element into the dashboard so that users and business leaders will be interested to play with it during events and roadshows organized by the Institute of Service Excellence.
Approach
We will be developing the dashboard using the d3.js library primarily. During the initial stages, we will be data analysis tool SAS Enterprise guide to conduct Exploratory Data Analysis to drill down on the more important information to be shown in the dashboard. Next, we will use data visualization tools such as Tableau and to plot the data in different charts and decide on which charts are more suitable to present the data in. We will then proceed to come up with prototypes of our dashboard and consult our project sponsor and supervisor before continuing with the development of our dashboard finally.