AY1516 T2 Group 18 Project Overview
Contents
Sponsor Background Information
Taylor Nelson Sofres (TNS) is one of the largest research agencies worldwide. They provide actionable insights to help companies make impactful decisions that drive growth. TNS is part of Kantar, one of the world's largest insight, information and consultancy group.
Introduction and Project Background
Understanding your target audience remains at the heart of successful marketing. The Connected Life is TNS's global syndicated study to understand connected consumer better. It is the largest and most comprehensive study of digital behavior of global consumers across the world.
The need for the study includes the following:
a) There was a gap in the market as no one was offering such comprehensive information about digital consumers
b) It was cost prohibitive for one client to undertake such a global venture and hence, clients were only doing these studies selectively and where budgets allowed
c) Other studies which also claim to have such a global footprint were either by publishers themselves or by media agencies, thus clients are apprehensive that the analysis offered by them is biased and hence an independent study like Connected Life has great appeal.
Project Motivation
With the advent of the internet and digital devices over the past decade, it has become increasingly complex to understand and influence the choices of consumers. The media landscape has been shifting and traditional marketing approaches no longer work as well today. Many companies now rely on digital marketing to reach out to consumers, where digital media growth have been estimated at 4.5 trillion online advertisements served annually with digital media spend to be at 48% in 2010. As such, it brings forth the need to formulate new marketing approaches in connecting today’s consumers with companies. TNS hopes to generate actionable insights from the dataset of the Connected Life study that will help marketers come up successful marketing strategies to aid business decisions.
As the study covers across 50 countries and over 58 product categories, we will be delving down and focusing on Singapore and Malaysia markets, and the Fast-Moving Consumer Goods (FMCG) sector for the purpose of our analysis.
Project Objectives
The aim of this project is to help marketers from the FMCG industry identify target consumer profiles, digital media platforms, and as well as devices to allow for more targeted marketing strategies, thus maximizing return on investment (ROI) on their business decisions.
As a market research company, TNS would need to present its findings and insights from the study to senior management and marketers from various companies. As such, our aim is to provide an interactive and dynamic dashboard that will instinctively display crucial actionable insights to marketers without the need for them to be equipped with technical knowledge, nor spending time delving into the data themselves.
The final deliverables will therefore aim to:
- Identify FMCG target consumer profiles, digital media platforms they should use, and the type of device(s) used to best engage and connect with target consumers
- Allow end users to visualize data findings and generate actionable insights through the means of an interactive and dynamic dashboard
In order to achieve these objectives, more granular questions must be answered through the course of our analysis:
- Who are our target consumers?
- What are the digital media platforms and devices that allow marketers to get to my target consumers and connect with them?
- How do marketers improve their touchpoint planning?
- What are the digital media platforms and content that needs to be prioritized in order to drive engagement and advocacy amongst the target consumers?
- After engagement is done, how do marketers influence the mindsets and decisions of the connected consumer?
- How are marketers going to improve their company’s performance in order to enhance the connected customers’ satisfaction?
Project Scope
The project scope can be split into 4 main areas. They are the Overview, Digital Media Platforms, Devices and Consumers interactive visualizations. The overview visualization is a compilation of key indicators to support operational decision-making by senior management. The other three areas are visualizations that allow marketers to work around the selections and graphics to gain deeper understanding and insights about the data.
In order to visualize the data, the data should be cleaned in various ways such that allows meaningful visualization to take place. Fields that are irrelevant or redundant are removed or replaced with human readable detail for ease of visualization. For example, fields that are empty.
The 4 visualizations cannot be done without first understanding what data is available for each of the visualization. After consolidating the data, prototyping of the visualization is important as it give us an idea what are we trying to achieve and whether our visualizations actually help achieve the intended goals.
Implementation of the actual visualization shall begin after the prototype has been decided.
Project Methodology
See here for more information about our data
The technologies to be used in the project are:
1. D3.js, a Javascript library that provides numerous functions to manipulate data and drawing of graphics.
2. JMP Pro, a statistical data discovery tool. We use this tool in data cleaning and preparation.
Visualizations
1. Overview
a) This visualization aim to provide senior management the summary of key indicators for operational decision support.
b) Key indicators includes
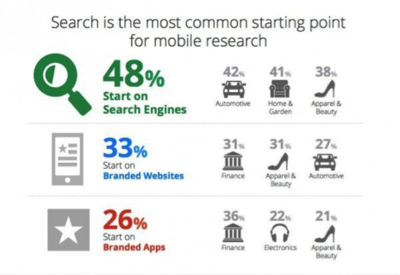
i. Digital Media Platforms
1. Percentage of consumers engaged in the various digital media platforms
2. The periods of the day consumers are most actively engaged in digital media such as In bed after waking up or early/late morning
3. The platforms in which certain categories of products are most engaged by consumers such as mobile application for emails and purchasing of movie tickets
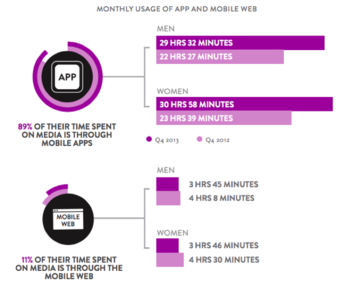
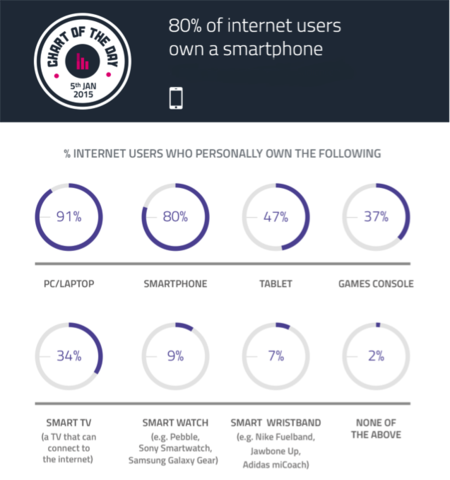
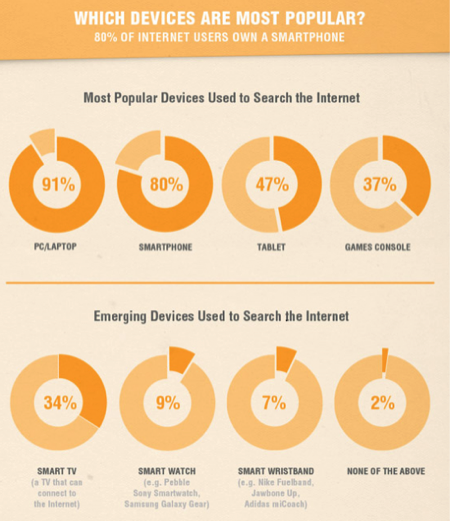
ii. Devices
1. Percentage of consumers engaged through the various devices
2. The periods of the day consumers are most actively engaged in various devices
3. The various services engaged by consumers with a certain device such as the laptop/tablet for watching movie and purchasing of apparels
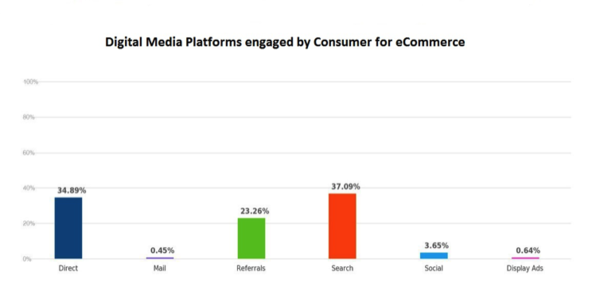
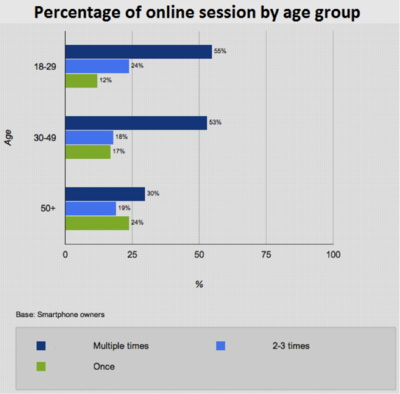
iii. Consumers Profiles
1. The common characteristics of consumers that are actively participating in eCommerce such as having both internet connection at home with laptop/tablet and smartphone
2. The category of services that the various groups of consumers engaged in such as consumers age between 16 - 24 are more active in the area of movies and TV
2. Digital Media Platforms
a) This visualization aim to allow marketers to gain insights from the manipulation of the data and various graphical representations regarding activity of the digital media platforms
3. Devices
a. This visualization aim to allow marketers to gain insights from the manipulation of the data and various graphical representation regarding the various devices engaged by the consumer
4. Consumer Profiles
a. This visualization aim to allow marketers to gain insights from the manipulation of the data and various graphical representation regarding the profiles of consumers
Project Limitations & Asssumptions
- Datasets given by the sponsor are only based on 2 markets - Singapore and Malaysia, and thus the analysis cannot be a representative for other markets.