AY1516 T2 Group 18 Project Overview
Contents
Sponsor Background Information
Taylor Nelson Sofres (TNS) is one of the largest research agencies worldwide. They provide actionable insights to help companies make impactful decisions that drive growth. TNS is part of Kantar, one of the world's largest insight, information and consultancy group.
Introduction
Syndicated market research studies that aim to target clients from multiple industries prove to be a good source of revenue for market research companies (insert source). However, research studies of this nature typically contain long survey questionnaires since it consists of questions catered for multiple industries. As such, it typically takes a respondent an average of 30 minutes to complete. Under such circumstances, the following will happen: firstly, obtained responses tend to be suboptimal because long questionnaires often put a strain on respondents and tire them out. This leads to a decrease in response rates and quality of responses; and secondly, because of the large number of survey questions (and hence, many resulting variables), an increase in monetary incentive is needed to incentivise respondents to complete the entire survey. Should the survey be shorter, the added incentive can instead be used to gather more respondents to improve their results. Hence, there is a need for market research companies to look for ways to shorten their surveys in order to uphold the accuracy of their results.
In this report, we aim to build an effective explanatory model that will help to reduce the number of variables needed for a market research study. By identifying pertinent variables and omitting variables that do not add value to the study results, we will be able to effectively reduce the number of survey questions in a study and reduce strain on survey respondents, provided that the behavior and demographics captured of the consumers in the industry remain the same in future studies.
As our obtained dataset consists of questions catered for numerous different industries, we will be focusing our efforts on the Personal Care industry. Personal Care products include facial care products, cosmetics, perfume or cologne, skin care products, and hair care products. Our objective would be to identify the significant factors (comprises of social demographic and economic profile, devices, digital media platforms, and online behavior in terms of time spent, frequency, and part of day for devices and activities engagement of Personal Care consumers) that would allow us to quantify consumers’ behavior with their purchase pattern outcome of buying Personal Care products.
Study Context
This report employs the dataset from a 2015 syndicated research study called Connected Life, conducted by Taylor Nelson Sofres (TNS) Singapore, a market research company under the WPP group. This study aims to identify the target consumer profiles, devices, and digital media platforms that today’s connected consumers engage in, so as to allow businesses from different industries to formulate more targeted marketing strategies to help them maximize the return on investment on their business decisions. Thus, the survey questionnaire is crafted in a way that would cover questions catered for a net of multiple different industries, including Personal Care, Airline, Mobile, etc. As a result, questions were crafted such that they were mostly general questions that cover the industry view. However, based on the results of the study, specific parts of the results could be taken out for further analysis for interested companies.
Project Methodology
See here for more information about our data
Modelling Process:
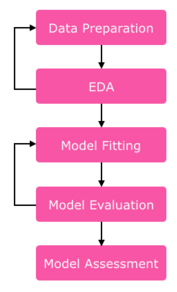
The figure above illustrates the explanatory modelling process used for our analysis. The full list of data preparation procedures have been listed in the following section. After data preparation, we proceeded with the exploratory data analysis (EDA) to help us understand more about the data. During this process, we often find ourselves iterating back to the data preparation stage upon observing the distributions of some of the variables.
Similarly during the model fitting stage, we find ourselves iterating through the model fitting and evaluation stage as we calibrate the model for optimal results. We evaluate and assess the performance of the models with several statistics such as Whole Model Test, Assessing Individual Parameters, Receiver Operating Characteristic (ROC) Curve, Fit Statistics, Misclassification Rate and Confusion Matrix.
Furthermore, after fitting and evaluating the model, we discover ways that we could improve our analysis. This brings us back to data preparation stage as we reorganize the data, followed by another round of EDA, model fitting and evaluation. Finally, we assess the models created and recommend list of actionable improvements to the marketers and market research firms.
Analytical Tools
| Capable to write scripts using JMP Scripting Language to customize analysis and generating reports | Capable to write scripts using SAS Language to customize analysis and generating reports |
| JMP holds data in RAM. It cannot handle data sets as large as can be handled by SAS. However, with less data it works faster due to memory processing | Can process data on secondary storage instead of RAM thus able to process huge amount of data or more data than the RAM can hold |
| Cheaper (about $5k for the first year license) | Expensive (over $100k for the first year license) |
| Reporting tool built-in with JMP that provides general-use reporting capabilities | Powerful reporting tool with its Business Intelligence and Analytics software that allows very detailed customization of reports |
| JMP does not provide a workflow or history of analysis to keep track of progress. | Organizes analysis into projects and diagrams with process flow diagrams thus able to track analysis procedure |
| JMP provides a very interactive GUI that allows users to do exploratory data analysis and try out various analytical methods easily and quickly | Provides a server version for ease of collaboration on data cleansing, integration, security and access |
The following are the consideration for choosing JMP as our tool of choice:
1. JMP is easier to learn as we had some experience in JMP. It is also easier to explore and manipulate the data with its GUI. This reduces the amount of time and effort for us to learn a new tool while allowing us to enhance our knowledge of JMP
2. Both tools have the statistical methods we expect to need for the project although SAS provides more options as compared to JMP. JMP has the decision tree, bootstrap forest, boosted forest and K nearest neighbour, which we expect to be sufficient for our project
3. Since we do not have huge amount of data that exceed the capacity that our RAM can hold, we do not require the capability of accessing secondary storage to process our data. Instead we do benefit from the relatively small data set that can be process by the RAM of our laptops which give a faster processing speed
4. Although both the JMP and SAS Enterprise Miner are accessible to us and both provide the capabilities for our project, we decided to use JMP due to the reasons mentioned above.