ANLY482 AY2017-18 T2 Group 31 Main Findings and Analysis
Findings and Analysis
Spatial Point Analysis
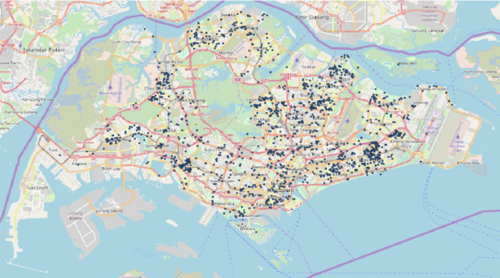
Conducted spatial point distributions in Singapore on QGIS
Focus on HDB Land-Use Type as highest number of notifications
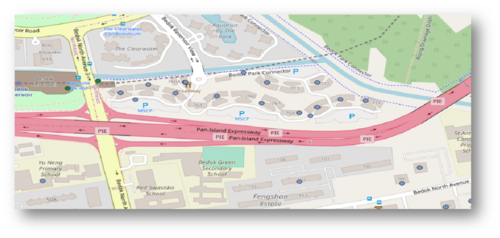
Case study done on Bedok Reservoir HDB region
Belongs to the same precinct with only one entrance at Bedok Reservoir View near roundabout
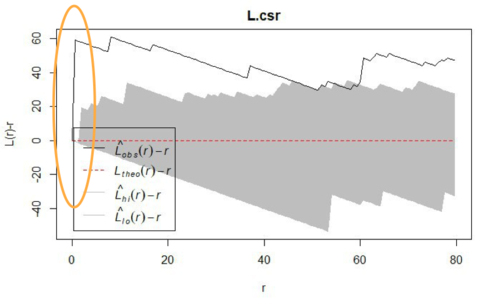
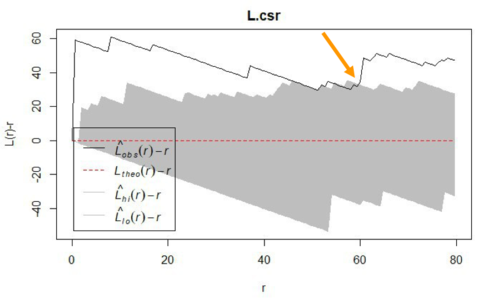
Modified L Test
Sharp increase due to data quality issues during collection of data
Duplicates and points that are very close together
Signs of statistically significant clustering even at very small radius
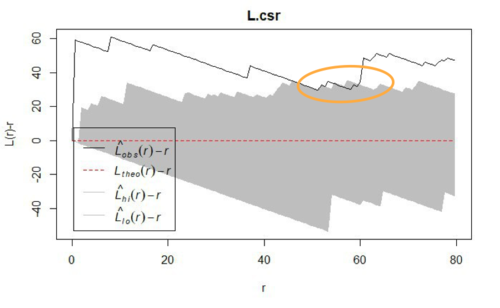
Between 54.5 metres and 62 metres
Clustering but not statistically significant
Statistically significant radius of 62 metres with signs of clustering
Likely to find another indiscriminately parked bike within 62 metres
Used as input for kernel density estimation
Kernel Density Estimation
To determine:
1. To identify cluster of locations that have higher occurrence of indiscriminate parkings
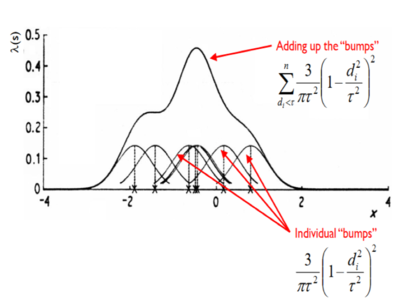
Function (kernel 𝑘) of a given radius (𝑟) “visits” each point in the study region. 𝑘 provides the weight of the area surrounding 𝑠 in proportion to its distance to 𝑠_𝑖
𝑘 is calculated as a function of the distance between point 𝑠 and 𝑠_𝑖, over given radius 𝑟
The density of the study region is obtained by summing 𝑘 of all points 𝑠_𝑖 within 𝑟
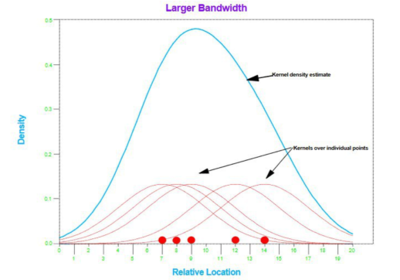
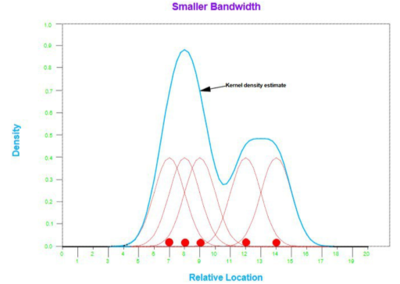
Kernel Density Estimations are sensitive to changes in radius values
Large radius leads to a smoother curve, but local details would be obscured
Small radius leads to many small spikes that are very localised
Using the statistically significant radius distance obtained from Modified L Test as a search radius within each event
Perform interpolation by transforming the graph to make it smoother
Individual kernels are summed up to produce a smooth surface
Quartic kernel type is used in QGIS

