ANLY482 AY2016-17 T2 Group15 Analysis & Findings
The data that we obtained were all provided by Edufy Secondary School. In total, we received data covering three batches of students from 2014 to 2016. Each batch of data covers the four years of secondary school that the student have been through. Just to make it clear, the data we have will be consist of the following:
| Batch of 2014 | Batch of 2015 | Batch of 2016 |
|---|---|---|
| Secondary 1 (2011) | Secondary 1 (2012) | Secondary 1 (2013) |
| Secondary 2 (2012) | Secondary 2 (2013) | Secondary 2 (2014) |
| Secondary 3 (2013) | Secondary 3 (2014) | Secondary 3 (2015) |
| Secondary 4 (2014) | Secondary 4 (2015) | Secondary 4 (2016) |
And for each year, we are also given the breakdown of the various examinations that each student has to take in a year. Here is the breakdown of the various data for each year:
- Secondary 1: CA1, SA1, CA2, SA2, Overall (5 sets of data)
- Secondary 2: CA1, SA1, CA2, SA2, Overall (5 sets of data)
- Secondary 3: CA1, SA1, CA2, SA2, Overall (5 sets of data)
- Secondary 4: CA1 OR CA2, SA1, SA2 aka Prelims, Overall (4 sets of data)
The 'Overall' refers to the overall score a student gets for that entire academic year. It is calculated by taking a combined score for CA1 & SA1 (37.5% CA1, 62.5% SA1) which makes up 40% of the total and CA2 & SA2 (25% CA2, 75% SA2) which makes up the remaining 60% of the total.

You can see a small glimpse of the data that we have received from our sponsor in the above image. This data is the first few columns of the Batch of 2016 CA1 data that we received. So this file will mainly contain the Secondary 1 CA1, Secondary 2 CA1, Secondary 3 CA1 and Secondary 4 CA1 from the Batch of 2016.
Each individual student's name is being coded. For example, in the image shown, the first student is a Secondary 4 student from the class S4-1 and his index number is 1. This protects the identity of the students that we are analyzing. Besides the main academic results, we also have other columns such as the second language of the student, the results of PSLE and 'O' Levels (our main objective), the gender of the student and the student's class in Secondary 1 and Secondary 2 (for inter-class analysis). There is approximately 800 columns per file, it varies based on the subjects offered during the particular year that the student is in.
After asking our sponsor for more data, we managed to get the CCA data of the students as well but only the CCA data during the students' graduating year. Here is a sample data of the CCA for the 'Batch of 2016':

As you can see, we are given the name of the CCA the student is involved in and also the number of points and the corresponding grade that the student received at the end of the four years of their secondary school. We are not given the CCA records at the end of each of their academic year.
For our entire data preparation and analysis, we will be using the following softwares:


Contents
Removed unnecessary columns from the data


Some columns are unnecessary and it will only add on to the size of the data and make things confusing. Such columns can be the grade of a particular subject for a student. The letter grade is derivable from the numerical score and thus we feel that it is unnecessary to keep the grade column. The name of the subject teacher is also unnecessary as we do not need to know the name of the teacher. Also, it is to protect the privacy of the teacher.
One other possible reason to remove a column can be that a particular subject is not being offered at all in that academic year. One of the signs of this is that the data for that particular subject column is all empty. And after clarifying with our sponsor on which are the subjects not offered in the various academic years, we can safely remove those subject columns.
Reorganized and restructured the data
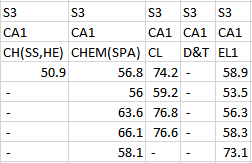

The original columns format of the data is not friendly for software to analyze and process it. The naming of the columns needs to change and the structure needs to change. If we were to upload the raw data to JMP Pro 13, the different columns will just appear as 'Column 65', 'Column 66', 'Column 67' for example. After we reorganized and restructured the data, it is now clearer and we can now pass the file into JMP Pro 13 to perform analysis.
Removed rows with missing data
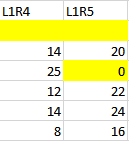

As we require the GCE 'O' Levels L1R4 and L1R5 score for our analysis, any rows without this field will be removed. In addition, the data consisted of a few students who retained and did not take their GCE ‘O’ Levels in the same year as his or her cohort, which resulted in missing data. As such, to prevent skewing the results, we removed these unnecessary rows that we cannot make use of.
Replace hyphens with blanks


In JMP Pro 13, columns with hyphens will be treated as a nominal variable even though the columns is a numerical one (e.g. scores of subjects). As such, to make these columns appear as numerical variables so that we can use it to plot certain graphs, we need to replace the hyphens with blanks.
For our Exploratory Data Analysis (EDA), we did some general descriptives to better understand the data before even venturing into analyzing it. Here are some of the general descriptives that we did:
Composition of Students
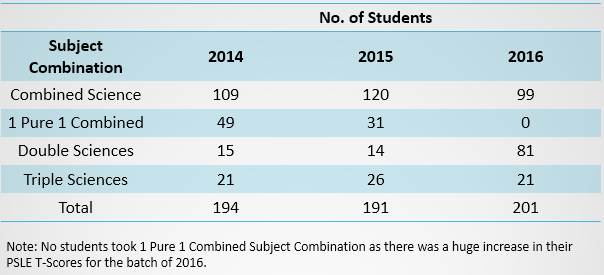
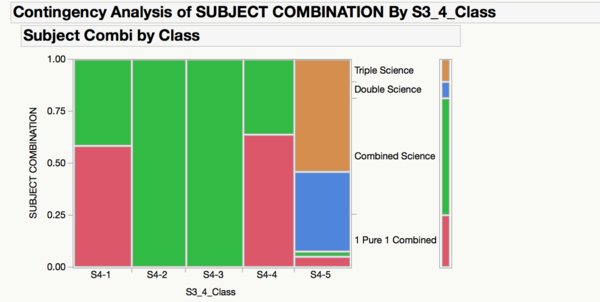
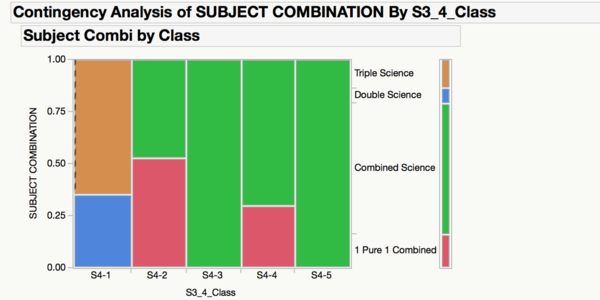
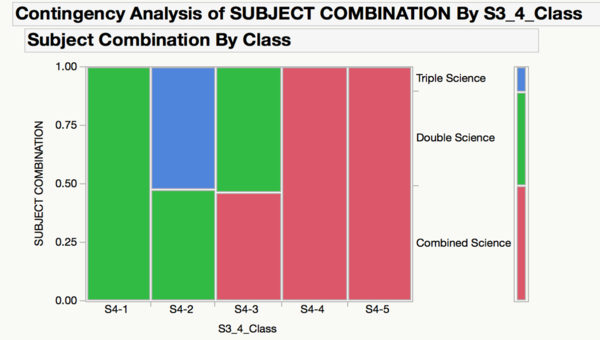
This table and the three graphs helps us understand the composition of each of the classes in each of the batches. This is so that we know what subject combinations are the students taking in each classes so that we can expect a certain score when we look at the later descriptives/analysis.
'O' Levels Performance by Subject Combination
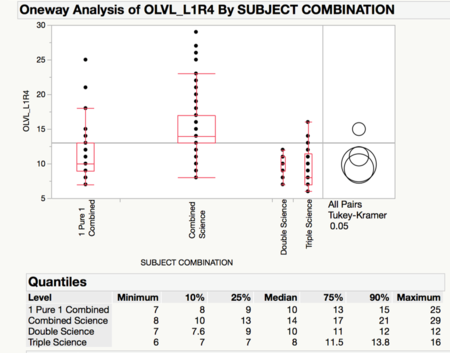
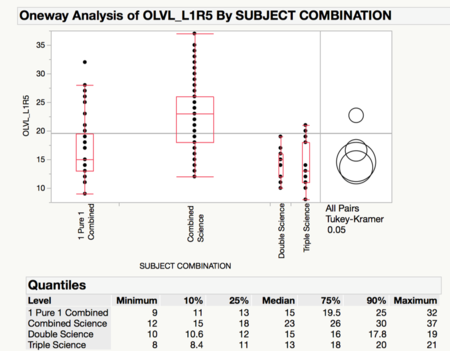
Moving on, we checked on the 'O' Levels performance (L1R4 & L1R5) by subject combination for all 3 batches. Generally, the trend is the same, with students in 'Triple Science' performing better than students in 'Double Science' who in turn perform better than students in '1 Pure 1 Combined' who in turn perform better than students in 'Combined Science'.
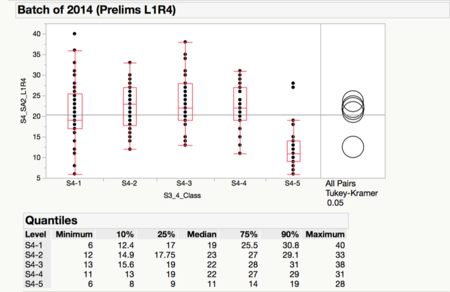
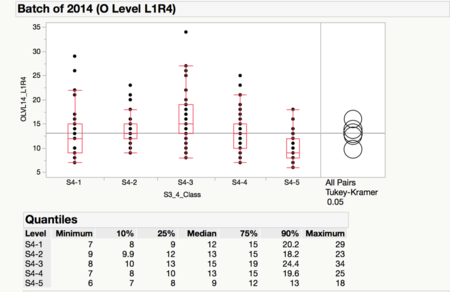
Prelims & 'O' Levels Performance by Class
We also attempted to compare the Prelims and 'O' Levels performance by class to see if there is any deviation in trend. However, the general trend remains that the class with students taking the 'Triple Science' subject combination tends to do better than students in other classes taking other subject combinations.
Evaluation of Current Practice
One of the objectives set out by our sponsor was that they wanted to find out whether Secondary 2 Mathematics scores or Secondary 2 Science scores is a better predictor of students’ ‘O’ Levels performance, based on their subject combinations. The analysis below shows the Nominal Logistic Regression analysis for the data from the three respective batches with 'O' Levels L1R4/L1R5 versus the Secondary 2 individual subject scores. Firstly, both the Secondary 2 individual overall subject scores (independent variables) and L1R4/L1R5 scores respectively (dependent variable) are inserted into the Fit Model for analysis.
We consider Secondary 2 subjects with p-value less than 0.05 to be statistically significant in affecting the L1R4/L1R5 scores in the ‘O’ Levels. As seen from the ‘Prob>|t|’ column in Table 1 above for the ‘O’ Levels batch of 2014, the Secondary 2 results for Maths, Science and English are significant with p-value of less than 0.05. The Secondary 2 results for Maths, Science and English (in the order of importance) is statistically significant in impacting the L1R4 scores. For example, if a student’s Maths score increases by 1 units, the log odds of his L1R4 scores decreases by 2.838 units. The VIF is also evaluated to ensure that it does not exceed 8, which is a sign of multicollinearity. The VIF results in Table 1 above proves that each of the Secondary 2 subjects is not highly correlated with another subject.

As students obtain higher scores in their ‘O’ Level Examinations, they will obtain a lower L1R4/L1R5 results. Hence, the more negative the correlation of a particular Secondary 2 subjects versus the ‘O’ Level L1R4/L1R5 score, the more important is the Secondary 2 subject in determining the future ‘O’ Level results. Through Table 2, as the Secondary 2 results for Maths, Science and English increases, students tend to have lower L1R4 scores.
R-squared is a statistical measure of how close the data are to the fitted regression line. Through Table 3, we understand that 55% of the variability in the L1R4 score is explained by the mean.
Through similar analysis on the other two batches, we have discovered similar strong significance of the Secondary 2 Science, Maths and English results in predicting the L1R4 scores. However for the Batch of 2015, the order of significance are as follows: English, Maths and Science, while for the Batch of 2016, the order of significance on L1R4 scores are as follows: Science, English and Maths.
A summary of the statistical significance in illustrated in Table 4.

However for the L1R5 scores, only the Science and Maths results are statistically significant for all batches, except the Batch of 2015 where English is considered a significant subject. The statistical significance of Secondary 2 subjects on L1R5 scores are shown in Table 5 below.

Hence, the school might also want to consider having English as an additional determining criterion for the students’ subject combinations, as it has a significant impact on their ‘O’ Level results.
To further analyze the performance of students, we selected a few students from each of the batch with similar PSLE scores and similar overall Secondary 2 scores. We drew overlay plots using JMP Pro 13 to see the Secondary 1 to Secondary 4 scores of these students. We want to see if these students, who ended up with different subject combinations, had any variations in their performance that is above or below the expectations of them.
This example is from the 'Batch of 2014': We chose the following students as shown in this table.

Then here are the overlay plots of their results from Secondary 1 to Secondary 4, from top-left to top-right to bottom-left to bottom-right. The 'Exam' mentioned in the x-axis here refers to the CA1, SA1, CA2, SA2, Overall scores as described much earlier.
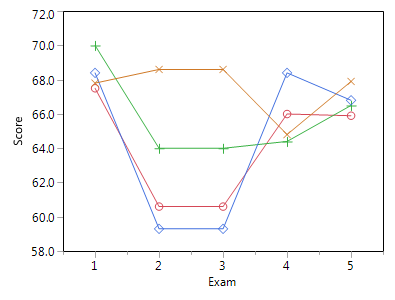
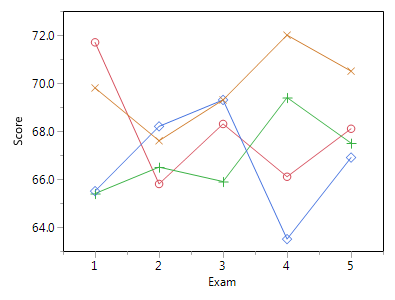
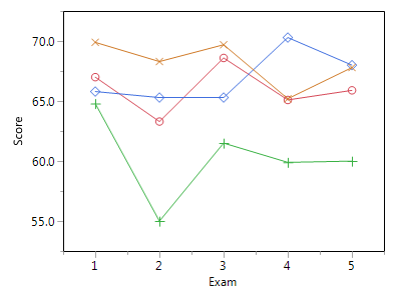
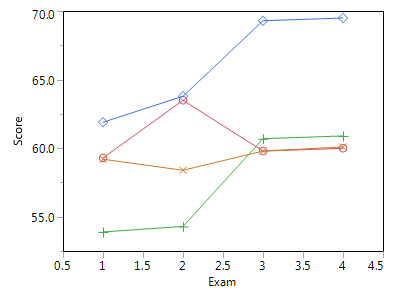
What we can observe is that the 'Double Science' student here performed better than the 'Triple Science' student. The 'Triple Science' student performed equally well as the student taking '1 Pure 1 Combined' science subject combination. What we can draw is that students with similar PSLE scores and Secondary 2 overall scores who take different subject combinations can end up with very different scores.
To determine which subjects are good predictors of students’ ‘O’ Level performance, we performed a multivariate regression analysis with the students’ respective subjects scores. By applying a regression analysis, we identified the relevant subjects that are significant in predicting students’ ‘O’ Level L1R4 and L1R5 scores.
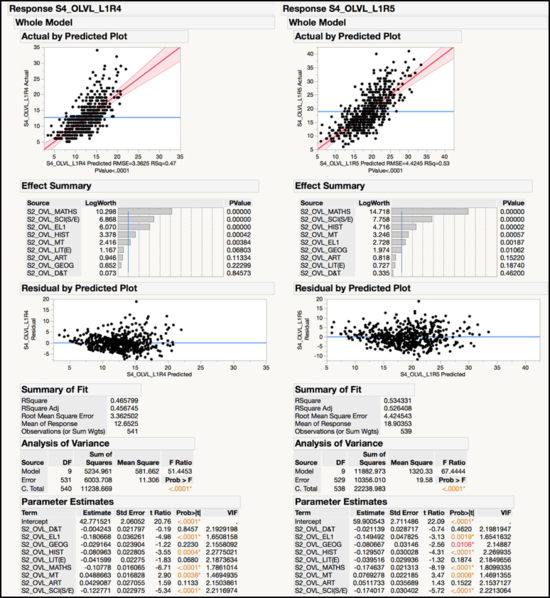
From our results, we also concluded that the following variables are significant (p-values < 0.05) in predicting both the GCE ‘O’ Level L1R4 and L1R5 scores: Mathematics, Science, English, History and Mother Tongue. Our two models achieved an adjusted R-Squared value of 45.67% and 52.64% respectively, which suggests that our model explains around half the variability of our data around the mean. Although our models achieved rather low R-Squared values, this is common in the fields of psychology in the prediction of human behaviour. Furthermore, our predictors have very low p-values, which suggests that they are statistically significant.
Having developed our regression model in determining students’ ‘O’ Level performance, we proceeded with the development of a web application that would enable teachers to easily and interactively achieve the following outcomes:
- Determine which is the ideal subject combination for a student and;
- Analyse the current academic standing of that student compared to his or her peers.
Having identified the relevant attributes that are statistically significant from our regression model, the next step is to design a model that would enable us to determine the range of possible outcomes of students’ ‘O’ Level performance, based on their subject combinations.
Monte-Carlo Simulation
To simulate students’ future performance, we have performed a Monte Carlo simulation to estimate the ‘O’ Level performance of students. Monte Carlo simulation is a type of simulation where repeated random sampling and statistical analysis are performed to compute the results. To apply this in determining the ideal subject combination for a student, we can break it down in the following steps:
- First, using the results of a current student, we obtained a group of students in the past who had similar Secondary 2 results.
- With this group of students, we further split them into groups according to their subject combinations and compute the mean and standard deviation for each subject combination.
- For each subject combination, we generated S independent samples of N random data which are normally distributed using the mean and standard deviation from each subject combination.
- A sample mean and standard deviation was calculated for each sample and at the end of generating all the samples, an overall mean and standard deviation of all the samples was computed.
- Using a confidence level of 95%, a confidence interval was calculated for each subject combination using the following formula:
With a range of estimated ‘O’ Level performance for each subject combination, determining the ideal subject combination will then be based on which subject combination will offer the lowest L1R4 or L1R5 scores as well as the spread of the confidence interval.
A. Subject Combination Determiner
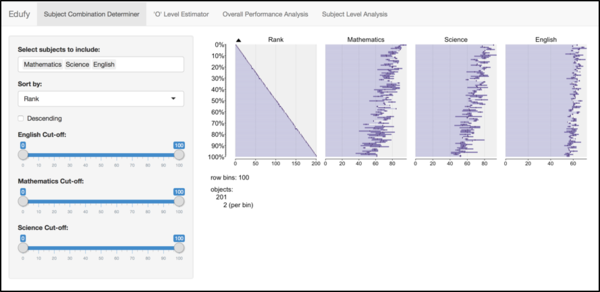
To allow teachers to determine the number of students that fulfil the criteria for the various subject combinations, we have adopted the use of table plots to provide the necessary visualization. Users can select the subjects to compare across, sort by one of the columns and set certain criteria (such as Mathematics more than 70 marks) and the visualization will update itself to show how many students fit the criteria.
B. 'O' Level Estimator
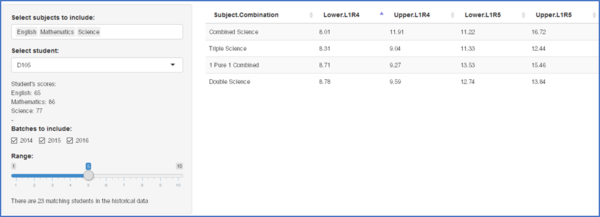
The 'O' Level Estimator allows the user to predict the L1R4 and L1R5 of students using historical data, based on our monte-carlo simulation. The user simply input a student’s Secondary 2 overall scores for Mathematics, Science and English, and pre-define a value for the range (i.e. the spread of student’s scores from the input score to take into consideration). With the input values, the application would search through the dataset for students whose performance meets the criteria that falls within the range, and return the average ‘O’ Level L1R4 and L1R5 scores of those students.
C. Overall Performance Analysis
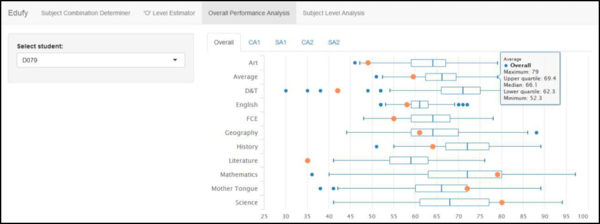
To help teachers better monitor the performance of students across subjects and time, we have adopted the use of box-and-whisker plots to provide the necessary visualisation. The box-and-whisker plot is a useful tool as it provides the user with a quick overview of the main statistical summaries (i.e. minimum, median, lower quartile, upper quartile and maximum). The orange dots represent the performance of the selected student, while the box-and-whisker plot describes the performance of the rest of the cohort of the same batch. We have also created various tabs (CA1 , SA1, CA2 and SA2) to allow teachers to monitor students performance during each of the assessments.
C. Subject Level Analysis

Subject teachers and Heads of Departments of various subjects can use box-and-whisker plots to track the performance of individual students throughout the entire year as well. Similar to the Overall Performance Analysis, the Subject Level Analysis provides a chronological snapshot of the individual student performance to track whether a student has been consistently improving or declining in his various subjects. From there, the teacher is able to meet up with the student and his parents to find out the issues surrounding the student should there be a fall in his grades in during one part of the semester.